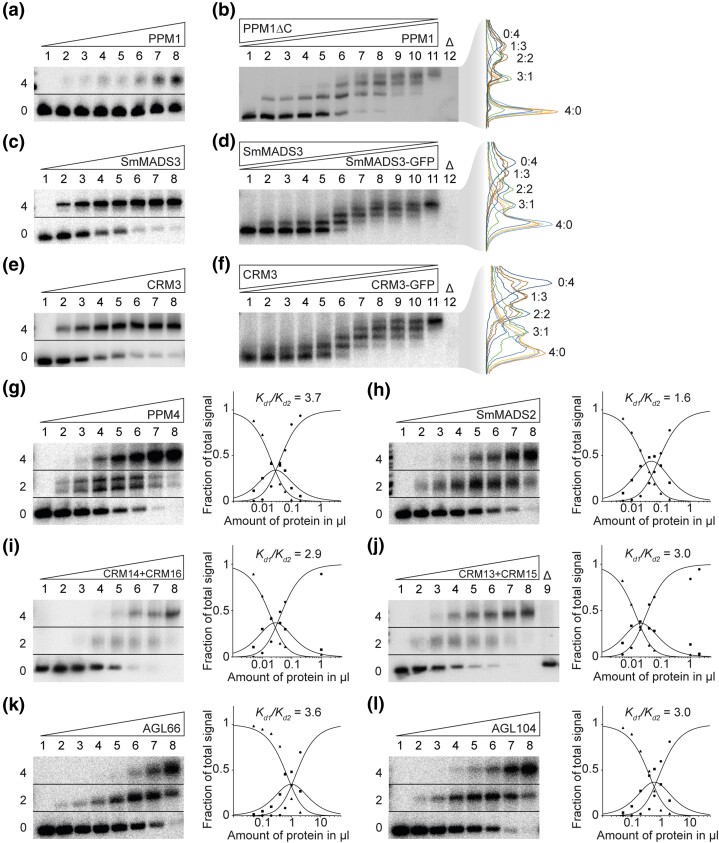
Fig. 1.
FQC formation capabilities of MIKCC- and MIKC*-type MADS-TFs from Physcomitrium patens, Selaginella moellendorffii, Ceratopteris richardii, and Arabidopsis thaliana. (a, c, e) Increasing amounts of in vitro transcribed/translated (a) PPM1, (c) SmMADS3, and (e) CRM3 protein, respectively, were coincubated together with constant amounts of radioactively labeled DNA probe 1. Two fractions of different electrophoretic mobility occur—a fraction of high electrophoretic mobility, constituting unbound DNA probe (labeled with “0” on the left of the gel picture), and a retarded fraction constituting a DNA probe bound by four proteins (“4”). (b, d, f) To determine the stoichiometry of the protein-DNA complexes observed in a, c, and e, (b) PPM1, (d) SmMADS3, and (f) CRM3 wild-type proteins were coexpressed at different ratios with PPM1ΔC, SmMADS3-GFP, and CRM3-GFP, respectively, and coincubated together with constant amounts of DNA probe 1. An overlay of measured signal intensities of the individual lanes is shown on the right. Each peak of the graph is labeled according to the ratio of wild-type and truncated/elongated protein of the corresponding fraction. (g-l) Increasing amounts of in vitro transcribed/translated (g) PPM4, (h) SmMADS2, (i) CRM14 + CRM16, (j) CRM13 + CRM15, (k) AGL66, and (l) AGL104 was coincubated together with constant amounts of radioactively labeled DNA probe 2. Three fractions of different electrophoretic mobility occur—a fraction of high electrophoretic mobility constituting unbound DNA probe (labeled with “0”), a fraction of intermediate electrophoretic mobility constituting a DNA probe bound by a single protein dimer (“2”) and a fraction of low electrophoretic mobility constituting a DNA probe bound by four proteins (“4”). Signal intensities of different fractions were measured and plotted against the amount of applied protein (triangles, free DNA; squares, DNA probe bound by two proteins; circles, DNA probe bound by four proteins). Graphs were fitted according to equations (1)–(3) described in Materials and Methods to eventually quantify and express FQC formation capabilities by Kd1/Kd2. In case of (g) PPM4, a double band was observed for the fraction of intermediate electrophoretic mobility, likely caused by different conformations of the DNA-bound protein dimer. As negative control, 2 µl of in vitro transcription/translation mixture loaded with the empty pTNT plasmid were added to the binding reaction (“Δ”). (a, c, e, g–l) Applied amounts of in vitro transcription/translation products were (lanes 1–8) 0, 0.05, 0.1, 0.2, 0.4, 0.6, 1, and 2 µl, whereby CRM3, PPM4, SmMADS2, CRM14 + CRM16, and CRM13 + CRM15 were prediluted 1:10 and PPM1 and SmMADS3 were prediluted 1:20 with BSA (10 mg/ml). (b, d, f) 3 µl of in vitro transcription/translation product were applied to each lane. Ratios of both template plasmids used for in vitro transcription/translation were (lanes 1–11): 0:1, 1:9, 1:7, 1:5, 1:3, 1:1, 3:1, 5:1, 7:1, 9:1, 1:0.

