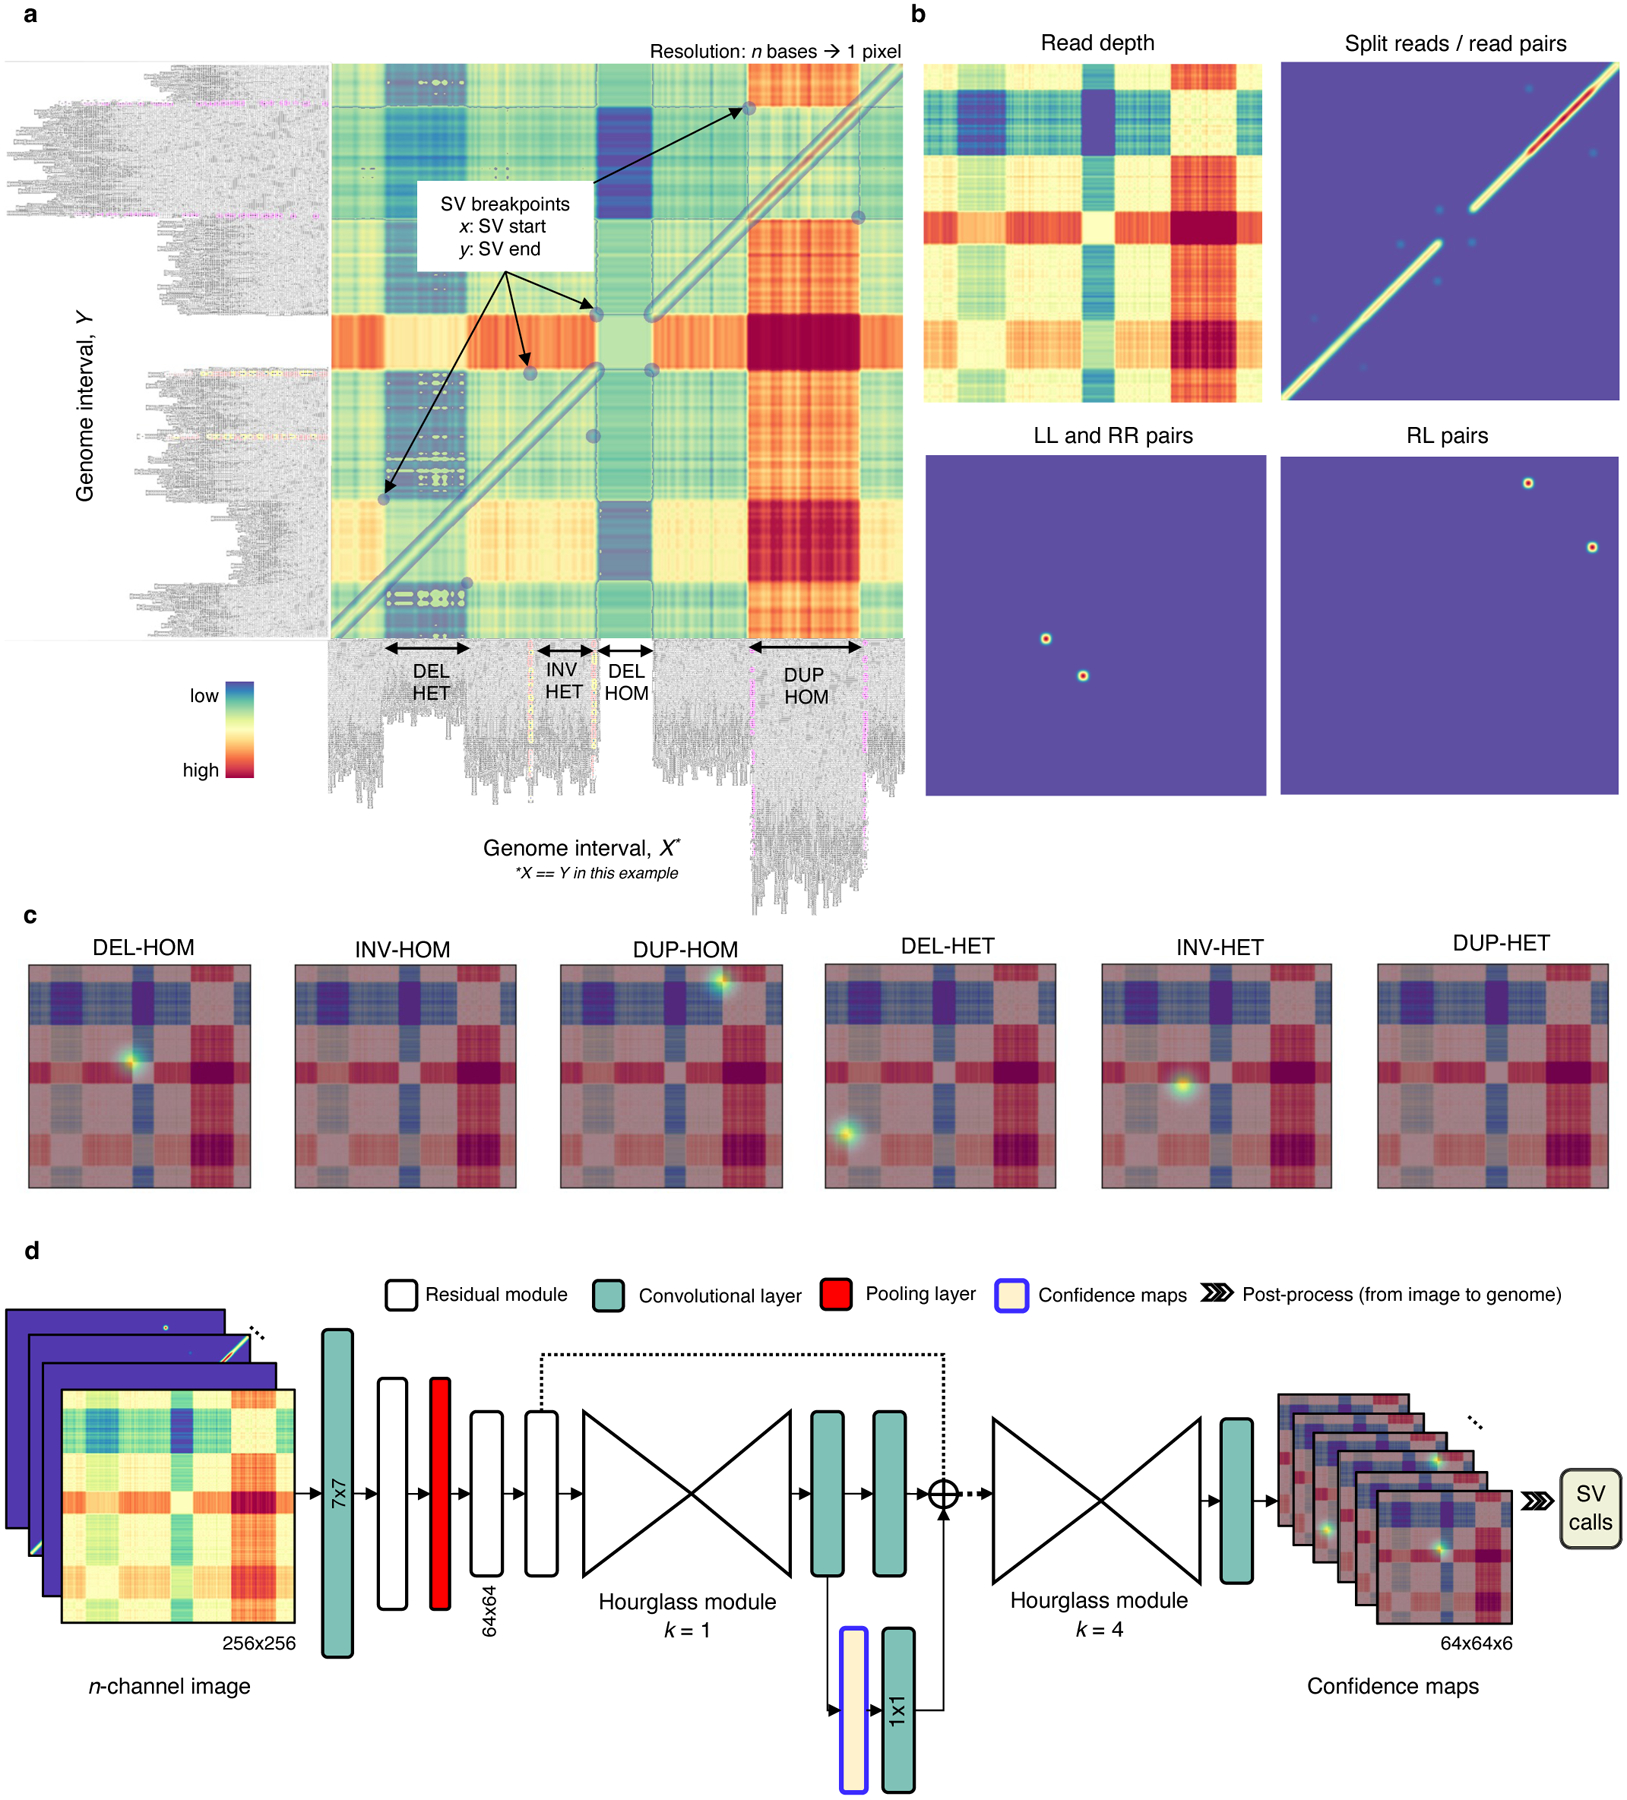
Fig. 1.

Overview of the Cue framework. a. Conversion of sequence alignments to images. Alignments from a 150kbp synthetic genome interval (visualized in IGV [34]) are shown on the -axis and -axis of the resulting image (displaying the overlay of several signal channels), annotated with four different SVs in this interval. The four highlighted pixel keypoints in the image correspond to the breakpoints of each SV (given by their start coordinate on the -axis and their end coordinate on the -axis). b. SV image channels representing different signals. Given two loci: the read-depth channel shows the difference in depth between the loci; the split-read/read-pairs channel shows the number of split reads or read pairs mapping to both loci; the LL and RR pairs channel shows the number of read pairs mapping in the LL or RR orientation – such pairs are indicative of an inversion; and the RL pairs channel shows the number of read pairs mapping in the RL orientation (where the second read in the pair maps to an earlier position of the reference) – such pairs are indicative of a duplication. c. SV breakpoint confidence maps predicted by the network given the image in A for homozygous (HOM) and heterozygous (HET) DELs, INVs, and DUPs. For simplicity only the read-depth channel is shown as the background. The bright kernels in each map represent a high confidence that the breakpoints of an SV of that specific type and genotype occur at that location, e.g. each pixel in the DEL-HOM map encodes its probability to be a homozygous deletion keypoint. d. The architecture of the stacked hourglass network used in Cue. It takes an -channel image as input and generates a confidence map for each supported SV type and genotype. The predicted confidence maps are then post-processed to produce the final SV callset.
