. 2023 Apr 3;59(36):5312–5328. doi: 10.1039/d3cc00573a

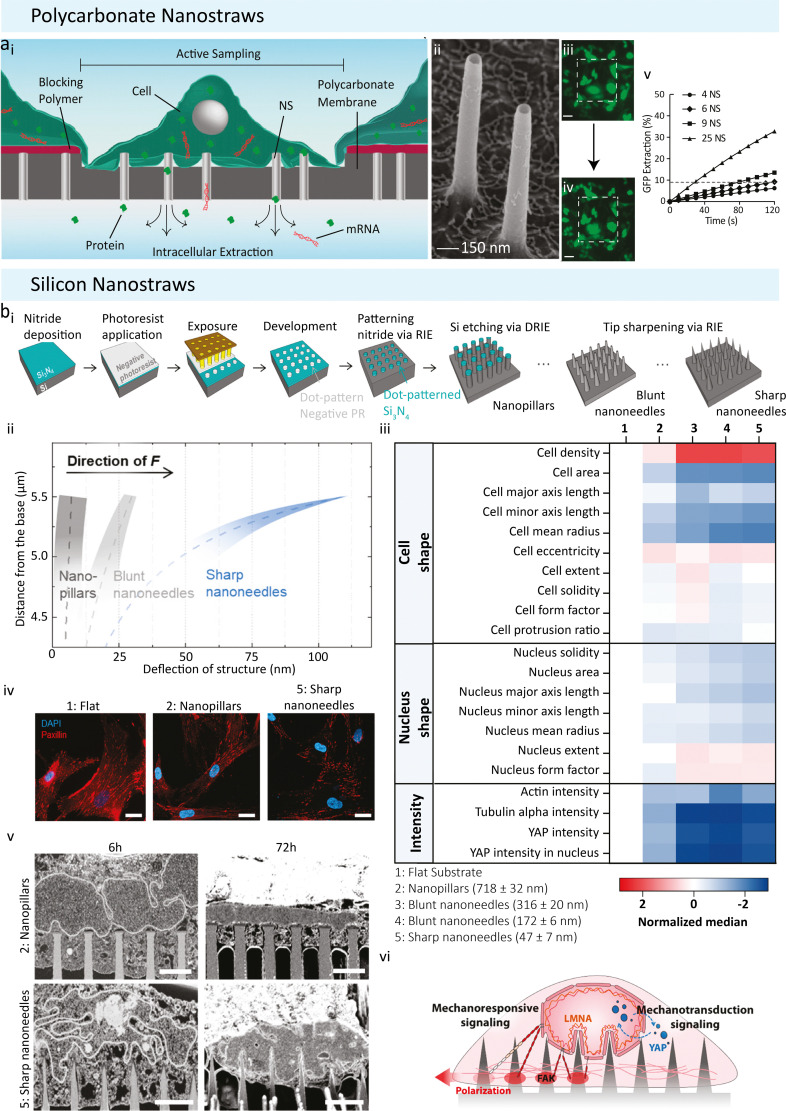
Fig. 2. Nanostraw use adapted from Cao et al. and Seong et al. (a) Polycarbonate nanostraws adapted from Cao et al. (i) Polycarbonate nanostraws allow intracellular species within the cell to diffuse through the NS and into the extraction buffer below the membrane. The size of the sampling region can be defined lithographically so that only the cells that grow in the active regions are sampled. (ii) Tilted view (45°) SEM image of the 150 nm diameter NS. (iii) and (iv) Fluorescent microscopy images of GFP of a culture of 26 cells on a 200 × 200 μm NS sampling region (white dashed squares, scale bar = 50 μm). (iii) GFP-expressing CHO cells before sampling. (iv) GFP-expressing CHO cells immediately after sampling. Locally diminished GFP intensities (dark spots) were observed in the cells after sampling, corresponding to the locations where GFP was removed from the cells. Brightness was increased to highlight the spots. (v) The percentage of the cell's initial GFP that diffuses into the extraction buffer as a function of time and the number of NS (the dashed line indicates the GFP extraction level after 2 min of diffusion from six NS). Reproduced from ref. 36. Copyright 2017, National Academy of Sciences. (B) Size-Tunable silicon based Nanostraws reported by Seong et al. (i) Schematic detailing the photolithography and dry silicon etching processes. Silicon nitride was deposited as a hard mask onto a silicon wafer, dot arrays of photoresist were patterned on the nitride layer by photolithography, silicon nitride, unprotected by photoresist was reactive ion etched (RIE), nanopillar arrays were produced via deep reactive ion etching (DRIE), and sharpened into nanoneedle arrays. (ii) Deflection of nanopillars (Dtip = 718 ± 32 nm), blunt nanoneedles (Dtip = 316 ± 20 nm), and sharp nanoneedles (Dtip = 47 ± 7 nm) when 300 nN of traction force (F) was imposed at the apex of each structure. Note that only the upper 1.5 μm of tip deflection is shown, as this is the region in which the deflection profiles differ the most. (iii) Normalized heatmap showing the change in population median on different substrates for a selected range of parameters. Note: data shown here are transformed and normalized to flat substrates; hence ‘1’ is blank (white). (iv) Representative confocal immunofluorescence images of paxillin-stained focal adhesions in hMSCs on different structures after 24 h of culture, scale bars = 25 μm. (v) Visualization of nuclear membrane–structure interfaces using FIB-SEM. FIB-SEM images show the extent of plasma membrane and nuclear envelope deformation after 6 h and 72 h of culture on nanopillars (Dtip = 718 ± 32 nm) and sharp nanoneedles (Dtip = 47 ± 7 nm), respectively (scale bars = 2 μm). Reproduced from ref. 38. Copyright 2020, American Chemical Society.

Fig. 2