. 2023 Apr 3;59(36):5312–5328. doi: 10.1039/d3cc00573a

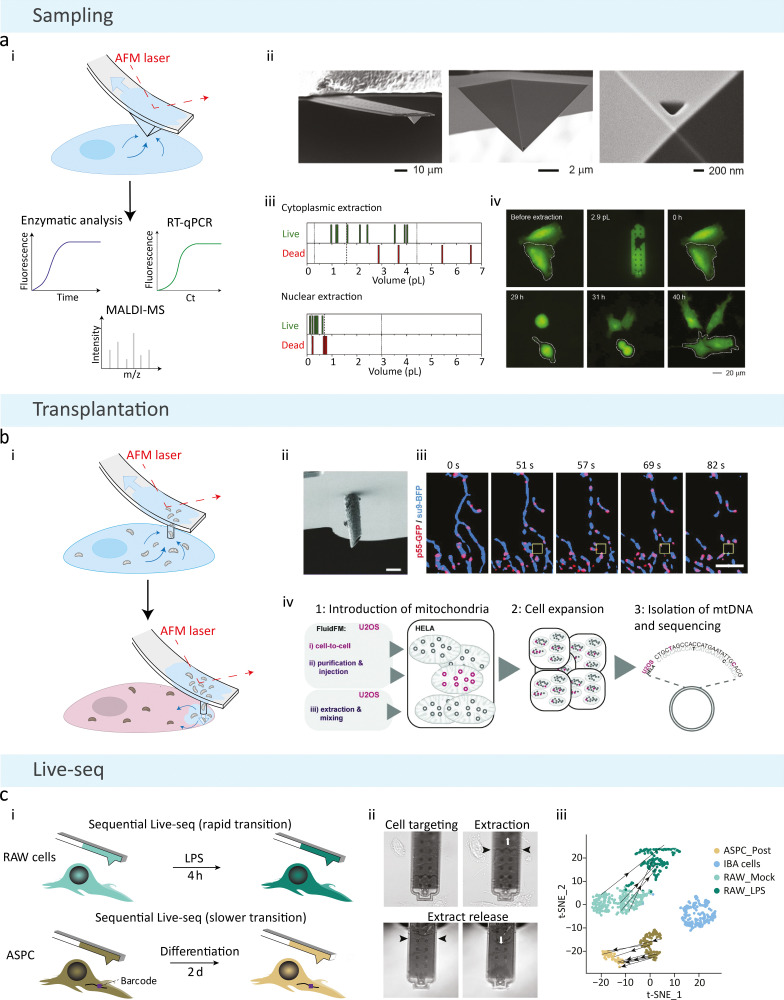
Fig. 3. Schematic of FluidFM methodologies. (a) Basic FluidFM sampling consists of an AFM cantilever with a continuous pressure-driven channel. (i) A pyramidal tip with a triangular aperture is inserted into a cell, and negative pressure is applied to aspirate the contents of the cell for downstream analysis. (ii) Scanning electron micrographs of the FluidFM probe for cellular sampling. (iii) Cell viability as a function of FluidFM extraction volumes from the cytoplasm and nucleus, where each line represents one count. The dashed line indicates the median, dotted lines represent the minimum and maximum native volumes. (iv) Fluorescent time-lapse imaging of an extracted cell (2.9 pL removed from the cytoplasm using FluidFM), marked with a dashed line. The extracted cell behaved similarly to the adjacent non-extracted cell, where they became round and divided to produce daughter cells at the same time. Reproduced with permission from ref. 18. Copyright 2016, Elsevier. (b) Mitochondrial transplantation from one cell to another is achieved with a cylindrical probe and a larger aperture size. (i) Following aspiration of mitochondria from the host cell, the probe is inserted into a new cell, and positive pressure is applied to inject the host's mitochondria. (ii) Scanning electron microscopy image of the cylindrical probe used for combining extraction and injection of mitochondria (scale bar = 2 μm). (iii) Time-lapse imaging of mitochondria and mitochondrial nucleoid extraction, showing an overlay of the mitochondrial matrix (su9-BFP) and mitochondrial nucleoids (p55-GFP), where the yellow box illustrates the position of the cantilever (scale bar = 5 μm). (iv) Procedure for quantifying mtDNA uptake and maintenance after transplantation, illustrating two FluidFM transplantation methods (cell-to-cell transplantation and injection of purified mitochondria), and the control performed for non-specific uptake (mixing with extracted donor cell mitochondria). Reproduced from ref. 66. Copyright 2022, PLOS. (c) FluidFM extraction is combined with Smartseq2 technology to form Live-seq: sequential transcriptomic profiling of live single cells. (i) Sequential sampling was performed in a rapid (top) and slow (bottom) cell state transition, where a unique barcode was used in the 3′ untranslated region of a green fluorescent protein reporter to identify the same cell over longer time periods. (ii) Images of the Live-seq sampling procedure using FluidFM, where the black arrows show the level of buffer and extract inside the probe, and the white arrows represent the under- or over-pressure applied. (iii) Direct trajectories of sequentially sampled cells from projections of Live-seq data. Reproduced from ref. 64. Copyright 2022, Springer Nature.

Fig. 3