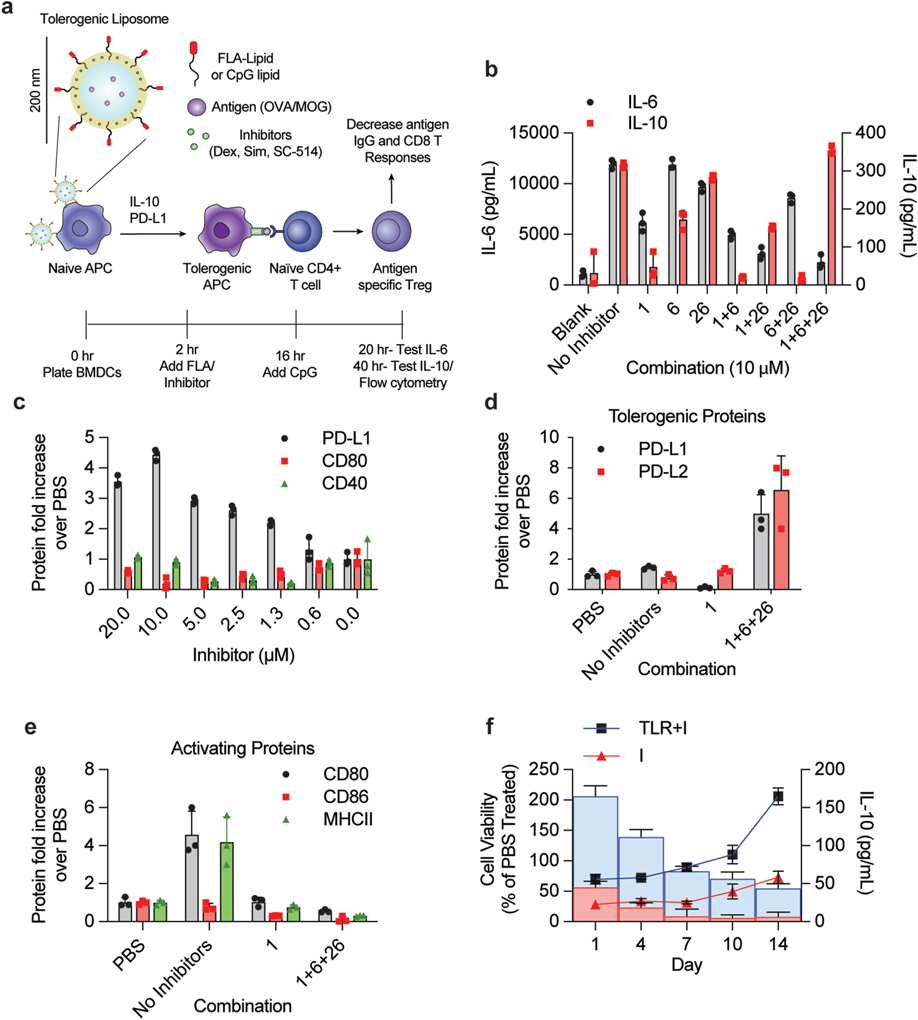
Fig. 1. Combining TLR agonist and immunomodulatory drugs generates tolerogenic APCs in vitro.
(A) Conceptual diagram representing tolerogenic liposome for generation of T regulatory response – a combination of inhibitors and TLR agonists generate more active Tregs through a push/pull mechanism. (B) Analysis of IL-6 and IL-10 production from combinations of immunomodulatory drugs and TLR agonists. 100 k BMDCs were plated and treated with a combination of 0.1 μg/mL FLA (TLR5 agonist) and immunoinhibitory drugs. After a 14 h incubation, cells were washed and treated with 0.5 μM CpG. Supernatants were drawn 4 h later (for IL-6) and 20 h later (for IL-10). Cytokine secretion was measured by ELISA. (C) Analysis of cell surface marker response to combination in BMDCs. Cells were treated with varying concentrations of a 1:1:1 combination of dex, sim, and sc-514 (concentration indicated on x axis is concentration of all inhibitors). Cells were analyzed via flow 24 h after CpG addition for PD-L1, CD80 and CD40. (D–E) Analysis of tolerogenic response on naïve spleenocytes. Methods from C was repeated on naïve spleenocytes (1 million per sample) in triplicate from three separate mice and then analyzed via flow. CD45+, MHCII+, CD11c+, CD19− cells (DCs) were gated and then stained for (D) PD-L1 and PD-L2 or (E) CD80, CD86 and MHCII. (F) Analysis of TLR agonist/Inhibitor combination lifetime in tolDC phenotypes. BMDCs were plated into 5 different 96 well plates (200 k cells per well) and incubated with 1 μM inhibitor combination (I, 1:1:1 combination of dex:sim:sc-514) in combination with 0.1 μg/mL FLA for 16 h. Cells were then washed and treated with 0.5 μM CpG+1 μM I. 20 h later, on day 1, one plate of cells was tested for viability using MTT assay and for IL-10 secretion via CBA. The remaining plates were washed and incubated with fresh media. On day 3, one plate of cells was challenged with 0.5 μM CpG for 20 h then analyzed for cell viability (line plots) and IL-10 secretion (bar graphs). This procedure was repeated on day 6, 9 and 13 with remaining plates. The TLR agonist and inhibitor treated samples (TLR + I, shown in blue) were compared to cells treated with just inhibitor combination (I, shown in red). Error bars indicate ± of SD of biological triplicate experiments. (For interpretation of the references to colour in this figure legend, the reader is referred to the Web version of this article.)

