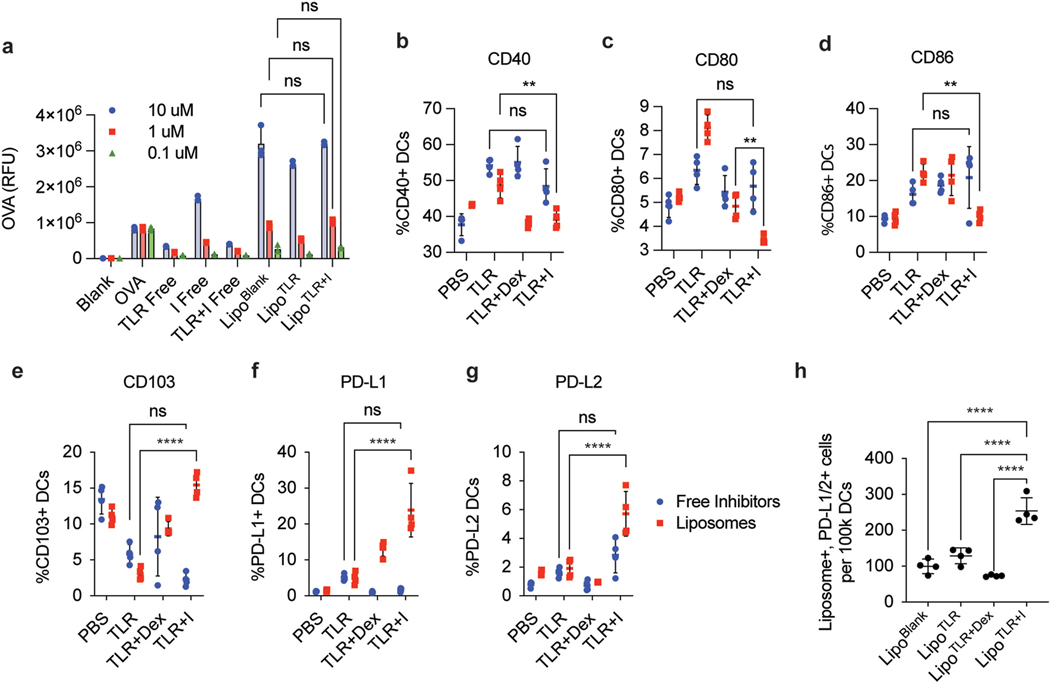
Fig. 2.
LipoTLR + I generate tolDCs that actively uptake antigen in vitro and in vivo. (A) Analysis of LipoTLR + I In Vitro. 100 k BMDCs were treated with free or liposomal formulations of TLR + I, TLR or I and analyzed via flow cytometry for liposomal uptake. Liposomes were synthesized with AF647-OVA for a total of 1 μg of OVA per .1 μM of inhibitor (using loading procedure from Figure S-4). Free inhibitor formulations were treated with equivalent OVA dose. 1 h after second treatment, cells were washed and analyzed via flow for OVA internalization (B) In Vivo Analysis of LipoTLR + I uptake. C57BL/6 mice (4 per group) were injected with either free or Lipo formulations of OVA and combinations of inhibitors to for the following categories (100 μg OVA/mouse, 10 umols inhibitor/mouse, 1 μg FLA/mouse, 10 μg CpG/mouse) [1]: OVA alone (PBS) [2], OVA + TLR agonists (TLR), OVA + TLR agonists + dexsamethasone only (TLR + Dex) or OVA + Inhibitor combination (TLR + I). For Lipo formulations, DiD was added at 0.01% total lipid loading to allow fluorescent analysis. Mice were injected with either Lipo or free combinations i.p. with FLA then CpG formulations on consecutive days. 24 h after final CpG injection, mice were sacrificed, popliteal and inguinal lymph nodes harvested, disassociated and stained for various immune cell markers. Lymph cells were analyzed via spectral flow and DC populations (CD45+, MHCII+, CD11c+, CD19−) analyzed for CD40, (C) CD80 (D) CD86 (E) CD103 (F) PD-L1 (G) PD-L2. (H) Mice treated with liposomes were gated on Liposome+ and PD-L1/2 + cell populations. Error bars indicate ± of SD of each mouse group (N = 4). Significance was determined by a two-way ANOVA with Tukey post hoc test for multiple comparisons. *p < 0.5, **p < 0.01, ***p < 1 × 10⁻⁴, ****p < 1 × 10⁻⁵..

