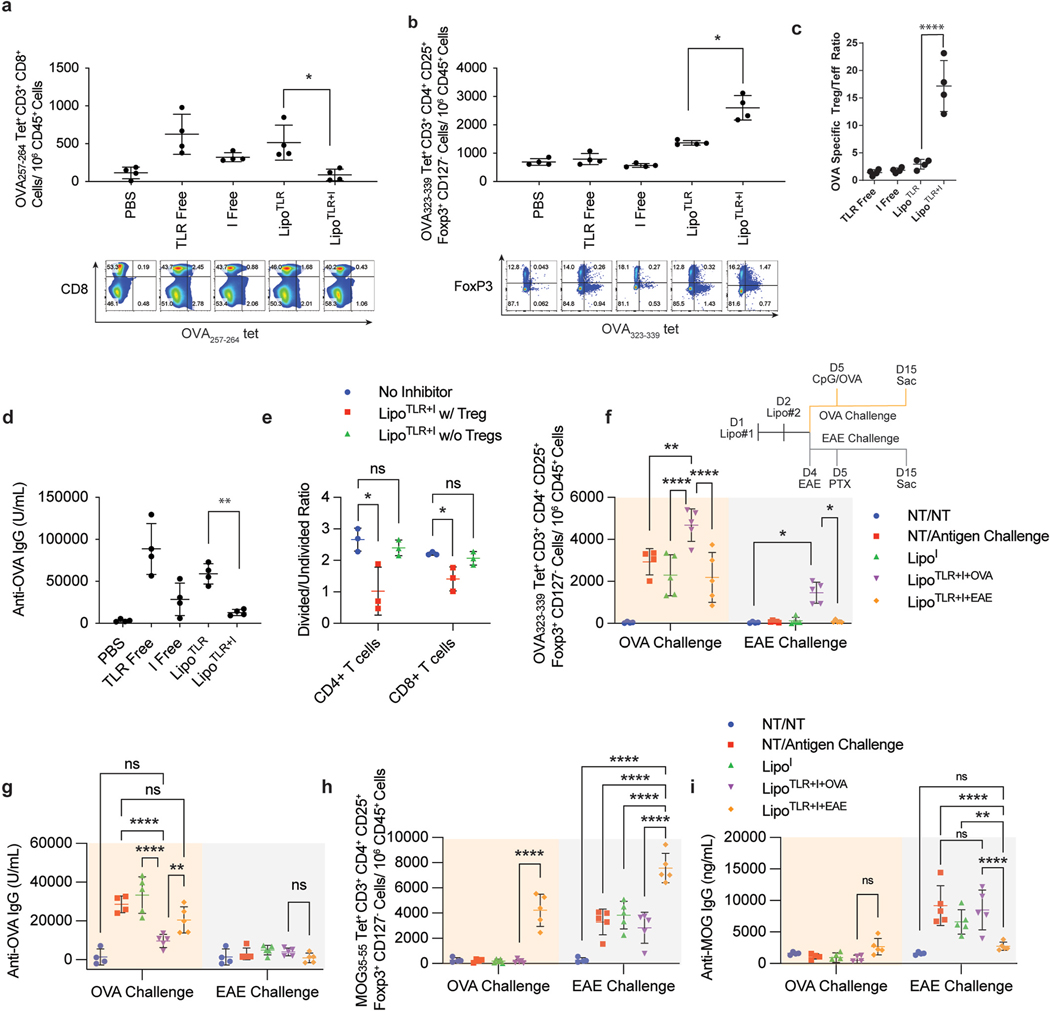
Fig. 3.
LipoTLR + I generate antigen specific Treg in vivo and Reduce Effector T Cells and IgGs. (A–C) C57BL/6 mice (4 per group) were injected with the following formulations: PBS control (PBS), OVA + free TLR agonists (TLR Free), OVA + Inhibitor free (I), liposomal OVA + TLR (LipoTLR) or liposomal OVA + Inhibitor combination (LipoTLR + I). Each formulation included combinations of 100 μg OVA/mouse, 10 μmol inhibitors/mouse, 1 μg FLA/mouse, 10 μg CpG/mouse. (A) On day 10, mice were sacrificed, their lymph nodes disassociated, the removed cells were stained and analyzed via flow. Lymph cells were analyzed for the number of CD45+, CD3+, CD8+, MHCI OVA epitope tetramer positive effector T cells were calculated. Representative flow plots of CD45+, CD3+, CD8+ cells showing distribution of CD8 (y axis) and major OVA257–264 MHCI tetramer signal (x axis). (B) Lymph cells from part A were also analyzed for the number of CD3+, CD4+, CD127−, FoxP3+, and OVA323–339 MHCII tetramer positive cells (OVA specific T regs) were calculated. Below are representative flow plots of CD45+, CD3+, CD4+ cells showing distribution of major OVA323–339 MHCII tetramer signal (x axis) and FoxP3 (y axis). (C) OVA specific Treg (from part A)/OVA specific T effector (from part B) ratio. (D) 10 days after last injection, serum was sampled and analyzed via ELISA for anti-OVA IgG. (E) Splenocytes from mice in part A were isolated, stained with CFSE and allowed to incubate with BMDCs for 16 h (3:1 spleenocytes to BMDCs). The cell mixture was then incubated with either the major MHCI epitope (for CD8 cells) or MHCII epitope (for CD4 cells) from OVA for 48 h. T-cell proliferation of spleenocytes was assessed via CFSE assay for both CD4 and CD8 cells. (F–I) LipoTLR + I treatment is selective for treatment antigen. Liposome formulations similar to part A were loaded with either OVA (100 μg/mouse) or MOG35–55 peptide (10 μg/mouse) and injected into C57Bl/6 mice on day 1 (FLA formulation) and day 2 (CpG formulation) (N = 5). Mice were then either challenged with CpG/OVA (10 μg/mouse/100 μg/mouse) on day 5 or injected to induce MOG specific EAE disease on day 4 and 5 (see methods). See experiment schematic (lower right of part E). On day 15, all mice were sac’d, popliteal lymph nodes analyzed via flow cytometery for antigen specific T cell populations and blood analyzed for anti-MOG or OVA IgG titers. (E) OVA323–339 MHCII tetramer + CD4+ T cell populations, (F) Anti-OVA IgG concentrations on day 15. (G) MOG35–55 peptide MHCII tetramer + T reg cells. (H) MOG35–55 peptide specific IgGs. Error bars indicate ± of SD of each mouse group (N = 4–5). Significance was determined by a two-way ANOVA with Tukey post hoc test for multiple comparisons. *p < 0.5, **p < 0.01, ***p < 1 × 10⁻⁴, ****p < 1 × 10⁻⁵..

