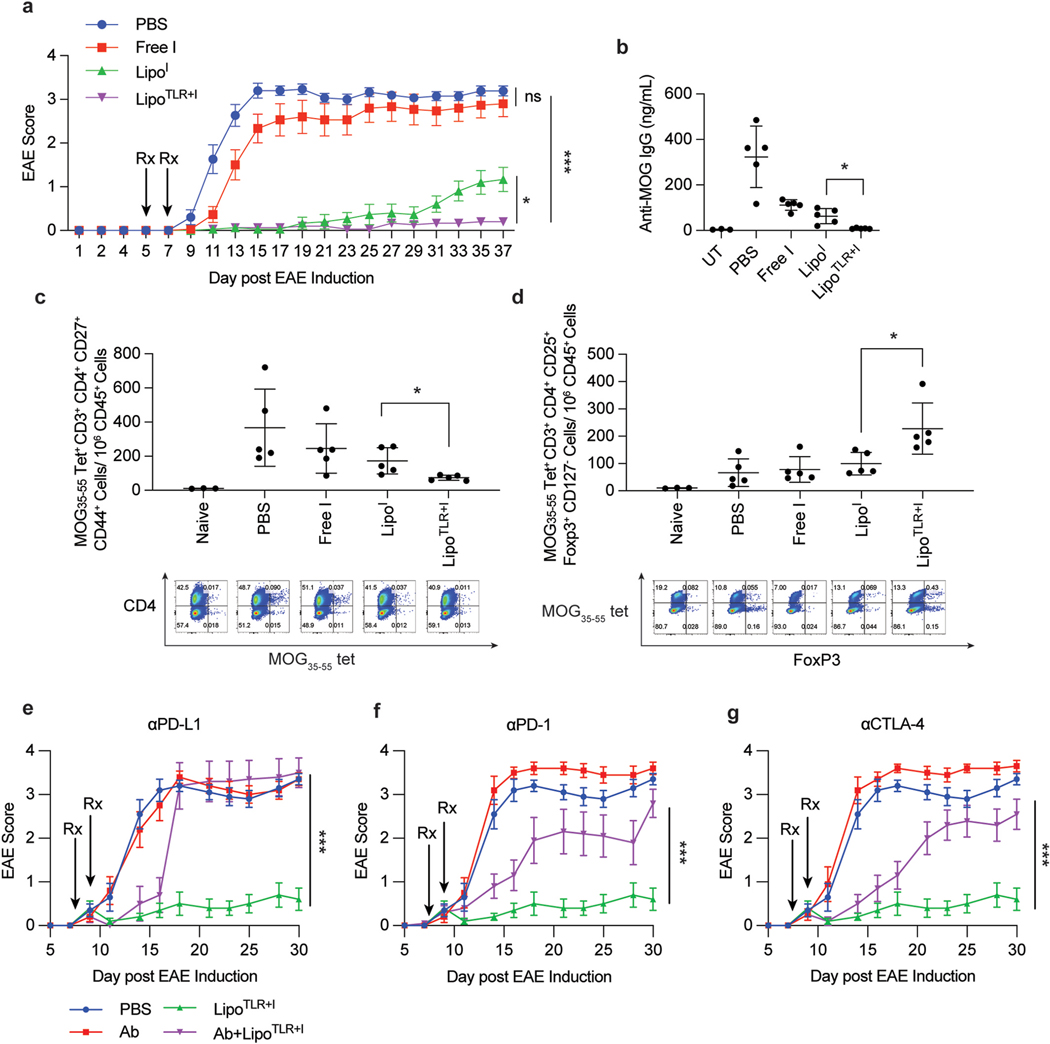
Fig. 4.
Tolerogenic Liposomes Prevent EAE Disease Progression via Antigen Specific Tolerance. (A) C57BL/6 mice (14–15 mice per group) were injected on consecutive days to induce EAE following procedure in methods section. Following final injection, the disease was allowed to progress for 5 days, at which point mice were injected with treatment candidates on day 4 and 5, allowed to rest for 48 h then treated again on day 7 and 8. Treatment groups were: PBS (on both days), Free I, LipoI, or LipoTLR + I. For all TLR containing formulations, the FLA formulation was given first (e.g day 4), then 24 h later the CpG formulation was administered (e.g. day 5). All formulations (except PBS) contained 10 μg of MOG peptide in each 100 μL injection. and MOG35–55 peptide was fully encapsulated in liposomal formulations. After final treatment, mice were monitored for 37 days and disease progression tracked. Error bars represent ±SEM of disease score. (B) Groups of 5 mice were treated similarly to part A, but sacrificed on day 14 following EAE induction. Serum was taken and analyzed for and MOG35–55 peptide specific IgG levels via ELISA. UT denotes an “untreated” mouse, a naïve C57BL/6 mouse without and MOG35–55 exposure (C) Lymph nodes from mice in part B were dissociated and lymph cells were stained for analysis of T-cells. The number of EAE peptide tetramer positive CD4+ activated T cells is shown. A representative flow plots of CD45+, CD3+, CD4+ cells show a distribution of CD4 (y axis) and MOG35–55 peptide tetramer (x axis). (D) and MOG35–55 peptide tetramer positive T reg cells from lymph nodes in part C. Below is representative flow plots of CD45+, CD3+, CD4+ cells showing distribution of MHCII-MOG peptide tetramer (y axis) and FoxP3 (x axis). (E–G) C57Bl/6 mice (N = 10) were similarly treated as in part A with LipoTLR + I, but with treatment starting on day 8 after EAE induction. Mice were then injected i.p with PBS or antibodies against mouse (E) PD-L1, (F)PD-1 or (G) CTLA-4. Mice were injected with 500 μg antibody on day 7 and day 10 and 250 μg antibody on day 14 and day 17. Statistical significance of AUC differences of EAE disease development curves was assessed by using one-way ANOVA and Tukey’s multiple comparison test in (A) and (E–G). Significance for B-D was determined by a two-way ANOVA with Tukey post hoc test for multiple comparisons. *p < 0.5, **p < 0.01, ***p < 1 × 10⁻⁴, ****p < 1 × 10⁻⁵..

