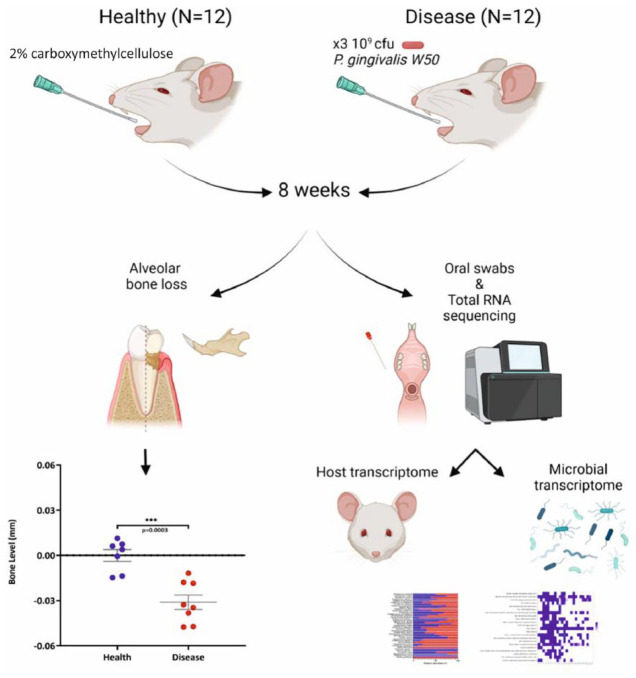
Figure 1.
Flowchart describing the experimental plan adopted for this mouse oral metatranscriptomic study. Alveolar bone levels have been reported 8 wk after oral gavage in control (blue) and Porphyromonas gingivalis–treated mice (red). Bone loss was expressed as negative values relative to the baseline. Each point represents the mean ± SD bone level for an individual mouse, with horizontal lines representing the mean bone levels per group (***P < 0.0005). The graphic was generated using BioRender.

