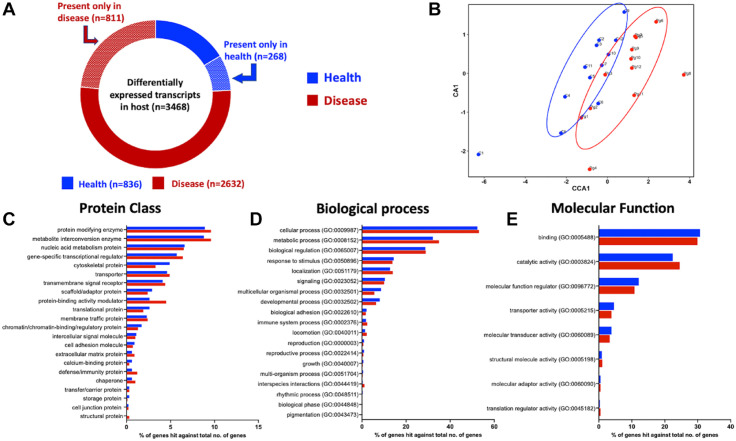
Figure 2.
Snapshot of the differentially expressed genes between health (blue) and periodontal disease (red) in the mouse host oral metatranscriptome. (A) Breakdown of differentially expressed genes based on the presence and/or absence in health and disease with fold change >2. (B) Canonical coordinate analysis (CCA) plots showing the distribution of the 24 mouse samples based on host gene expression. (C) Percentage breakdown of the differentially expressed genes in health and disease based on protein class. (D) Percentage breakdown of the differentially expressed genes in health and disease based on biological process gene ontologies. (E) Percentage breakdown of the differentially expressed genes in health and disease based on molecular function gene ontologies.

