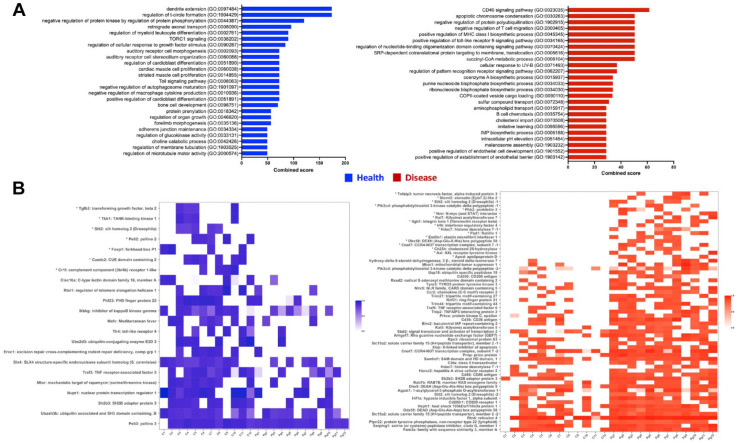
Figure 3.
Gene enrichment analysis of the differentially expressed genes in the mouse oral host metatranscriptome using Enrichr. (A) Top 25 biological process gene ontologies ranked according to Enrichr calculated combined score in health (blue) and disease (red). (B) Heatmaps depicting relative gene expression levels for the genes linked with immune-associated biological processes that were enriched in health (blue) and disease (red) according to Enrichr analysis. Samples C1 to C12 on the x-axis are related to health, and samples Pg1 to Pg12 are related to disease. The genes have been listed in decreasing order of fold change, and the genes marked with asterisks refer to ones that were present only in the indicated condition and completely absent otherwise.

