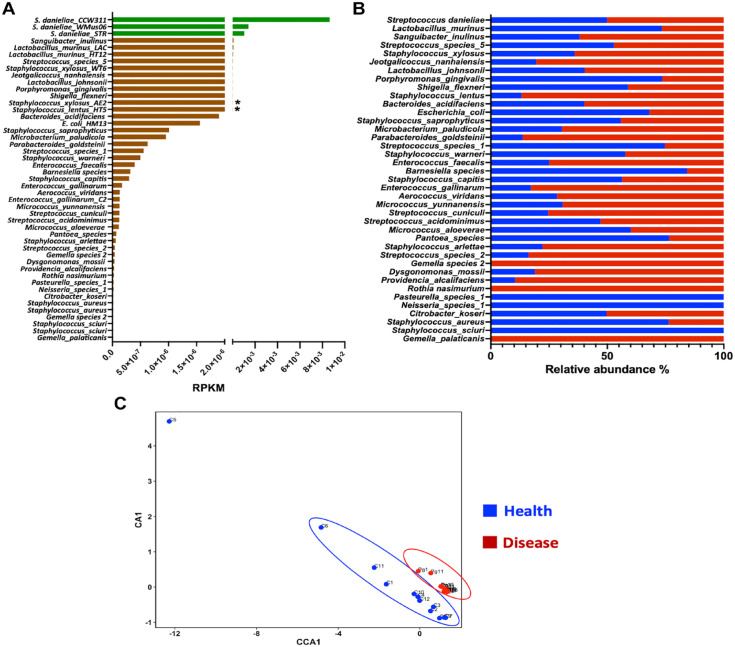
Figure 4.
Taxonomic profile of the mouse oral bacterial metatranscriptome. (A) Mouse oral bacterial taxa plotted based on decreasing levels of abundance in the entire oral metatranscriptome. The most dominant taxon, Streptococcus danieliae, is indicated in green, and the bars with asterisks refer to the taxa that showed significant differences in gene expression between the health and disease conditions. RPKM, reads per Kbp of transcript per million (Mbp) of mapped reads. (B) Individual mouse oral bacterial taxa expressed as relative abundances in health (blue) and disease (red) conditions. (C) Canonical coordinate analysis (CCA) plots showing the distribution of the mouse samples based on bacterial species-level taxonomic profiles.

