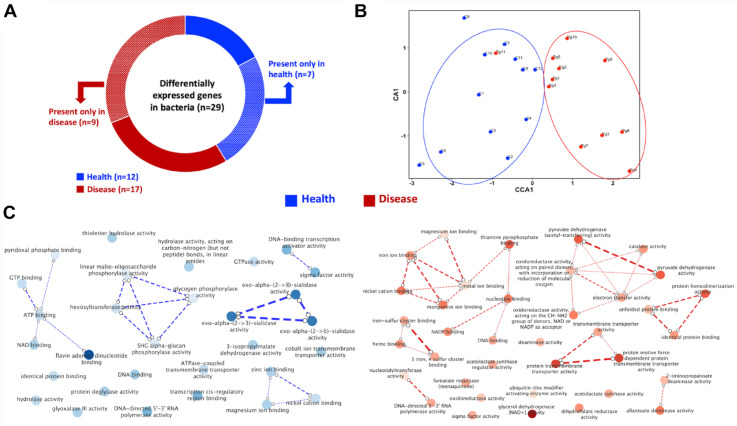
Figure 5.
Differential gene expression profile in the mouse oral bacterial metatranscriptome. (A) Breakdown of the 29 differentially expressed genes in health (blue) and disease (red) with fold change >2. (B) Canonical coordinate analysis (CCA) plots showing the distribution of the mouse samples based on bacterial gene expression. (C) Revigo bacterial gene ontology (GO) networks of the molecular functions in health (blue) and disease (red) linked to the differentially expressed bacterial genes. The light to dark shades of the bubble colors correspond to the effect size of the fold change in gene expression. Highly similar GO terms are linked by dashed edges, where the line width indicates the degree of similarity.

