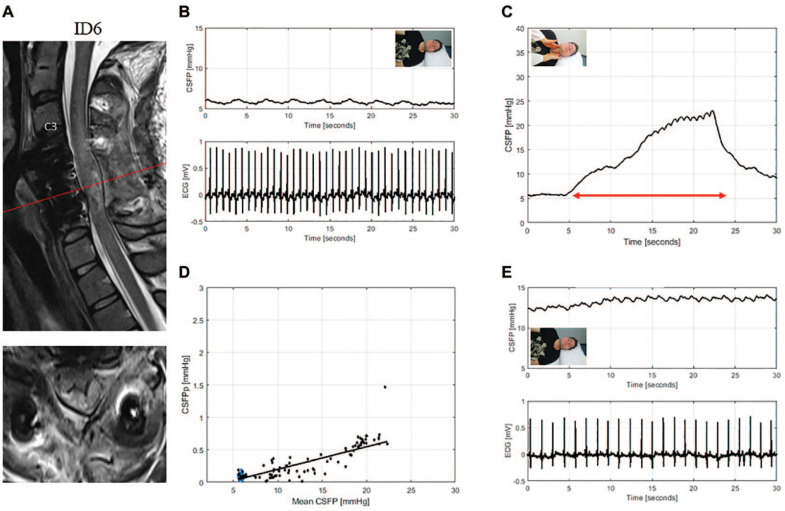
Figure 5.
T2-weighted MRI of the cervical spine for ID6 (patient with traumatic spinal cord injury, AIS: B) (A). Sagittal and axial images showed beginning cyst formation and edema, and were suggestive of spinal cord swelling against the dura despite sufficient bony decompression. CSFP is severely affected during resting state (B) but with a responsive Queckenstedt’s test (rise 15.1 mmHg) (C). Cardiac-driven CSFP peak-to-valley amplitude (CSFPp) at resting state (blue dots) and during Queckenstedt’s test (black dots) is plotted against mean CSFP (D). The regression line (in black) is reduced with a relative pulse pressure coefficient (RPPC-Q) equal to 0.03. Resting state CSFPp was recovered at the first follow-up session (E).

