Figure 1.
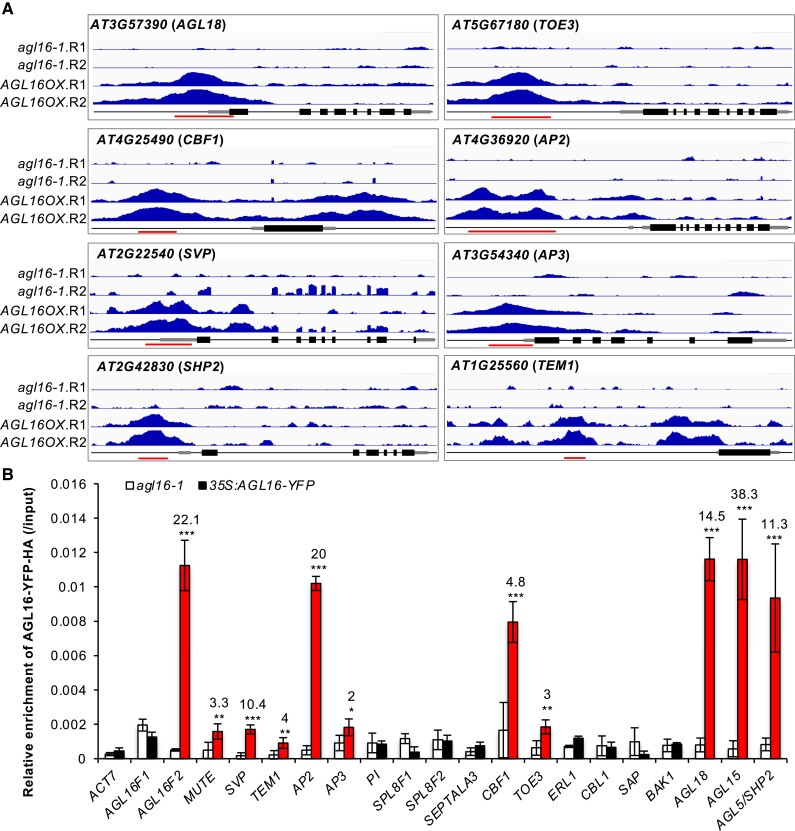
Validation of the AGL16 binding on target DNA fragments. A) Binding profiles for selected target genes. The TAIR10 annotation of the genomic locus was shown at the bottom of each box. For each panel, the profiles for two trials (R1 and R2) in agl16-1 background line were shown in the upper panel, while the profiles for agl16-1 35S:AGL16-YFP-HA (AGL16OX; two trials) were shown in the middle panel of each box. All the genes were from 5′-end to 3′-end with scale bars indicating sequence lengths of 500 bp. Note that data range for each gene in agl16-1 and AGL16OX was the same scale, but different genes could have different scales. Red lines marked the binding regions tested via ChIP-qPCR assays (B). B) ChIP-qPCR validation of AGL16 binding on 20 DNA segments. Significant enrichment (red bars) was defined with the following criteria: mean enrichment must be at least 2-fold higher than negative control ACT7, the enrichment for AGL16OX (in agl16-1 background) than agl16-1 must be higher than 2-fold change, and the amplification CT number of IP samples must be at least two cycles less than no-antibody controls. This experiment was repeated with another independent trial, which gave similar pattern. Statistics was carried out with Student's t-test with Bonferroni correction. ***P < 0.001; **P < 0.01; *P < 0.05.

