Figure 7.
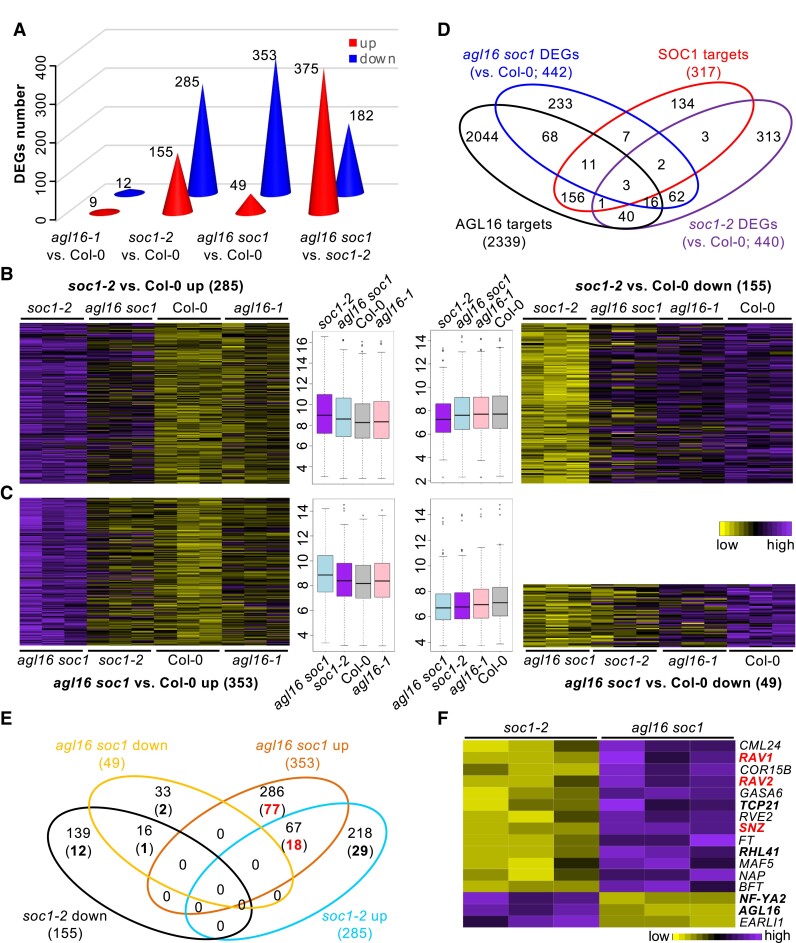
The AGL16–SOC1 module collaborates on regulation of genome-wide gene expression. A) The number of differentially expressed genes (DEGs) in three mutants. The exact number of up (red) or down (blue) regulated DEGs were given on each cone. B and C) Heatmaps showing the normalized relative expression of soc1-2 (B) and agl16 soc1 (C) DEGs in all four lines. The boxplots in the middle gave the data distribution pattern for each cluster. Box plots mark the 25–75% quartiles with the line in box representing the median. The lines extending from each box marked the minimum (5%) and maximum (95%) values of the dataset. Circles showed the outliers. D) Venn diagram demonstrating the overlap between DEGs and the AGL16 targets profile. E) A detailed comparison between the DEGs in soc1-2 and agl16 soc1 mutants with the AGL16 binding profile. Bold numbers in brackets showed the number of DEGs bound by AGL16. F) A heatmap showing the normalized relative expression of the DEGs related to flowering time regulation in the soc1-2 and agl16 soc1 mutants.

