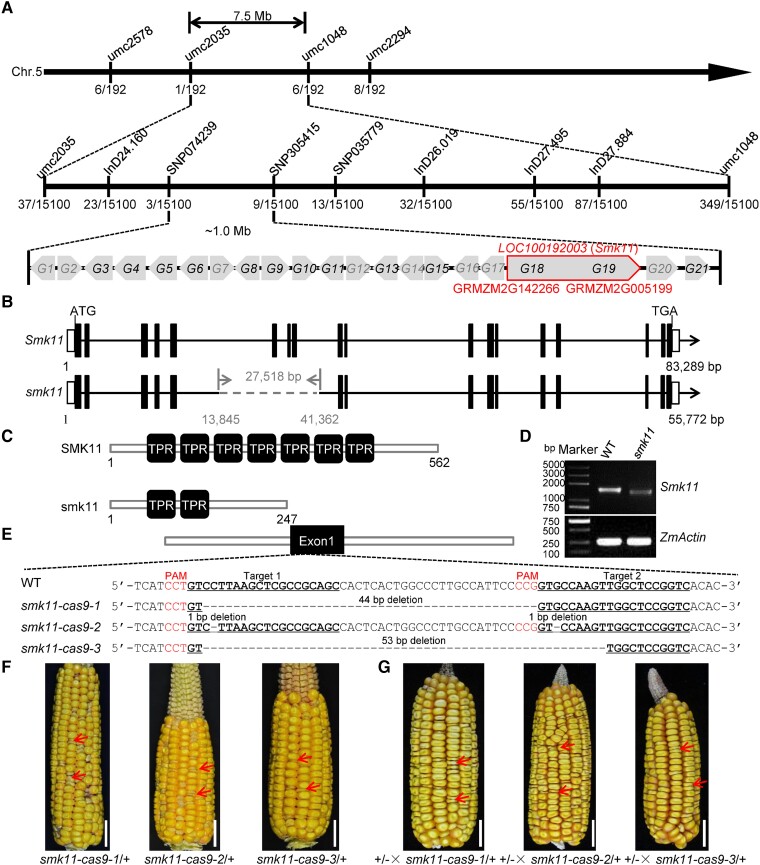
Figure 2.
Map-based cloning and allelism test of Smk11. A) Fine-mapping of Smk11 using F2 populations of B73×smk11/+ with 15,000 individuals. The numbers under each bar indicate the number of recombinants. Twenty-one genes (G1 to G21) were annotated between two markers SNP074239 and SNP305415 based on the MaizeGDB database. Genes in gray indicate that they are not expressed in the embryo and endosperm. Genes in black indicate that they are expressed in the embryo and endosperm. Two genes (GRMZM2G142266 and GRMZM2G005199) were annotated as one gene LOC100192003 according to NCBI database. B) Diagram showing the gene structure of LOC100192003 (Smk11) and smk11. The lines represent introns, the black boxes represent exons, and the white boxes represent 5′ UTR and 3′ UTR. The gray dashed line stands for the deletion fragment in smk11. C) Schematic diagram of the maize SMK11 and smk11 protein structures. D) RT-PCR analysis of the expression of Smk11 in 15 DAP kernels of smk11 mutant and WT. The amplification product was normalized against ZmActin. E) The sequence in the LOC100192003 locus is targeted using CRISPR/Cas9. The two gRNA sequences (Target 1 and Target 2) are underlined, and the protospacer adjacent motif (PAM) are shown in red letter and the gray dashes represent deletions. Alignments of mutant sequences from three independent transgenic lines are indicated. F) Mature F2 ear of Cal × smk11-cas9-1, Cal × smk11-cas9-2, and Cal × smk11-cas9-1. Arrows indicate the mutant kernels. G) Allelism tests were performed using crosses between heterozygous smk11 (+/-) and heterozygous smk11-cas9-1 (smk11-cas9-1/+), smk11-cas9-2 (smk11-cas9-2/+), and smk11-cas9-3 (smk11-cas9-3/+). Arrows indicate the mutant kernels. Scale bars = 1 cm (F–G).

