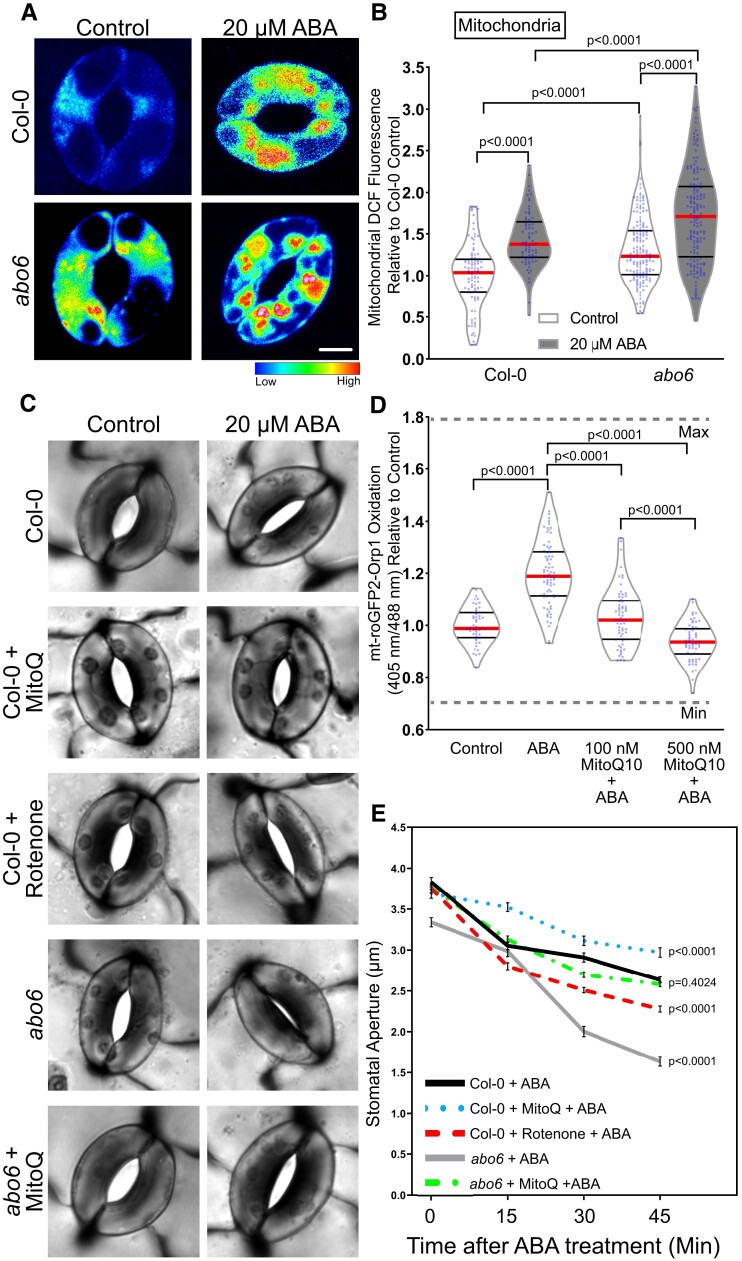
Figure 6.
Perturbations in mitochondrial reactive oxygen species influence the rate of ABA-induced stomatal closure. A, Confocal micrographs of dichlorofluorescein (DCF) fluorescence following conversion to LUT for ABA overly sensitive (abo6) guard cells treated with control buffer or 20 µM ABA for 45 min. Scale bar: 5 µm. B, DCF fluorescence was quantified within mitochondria of Col-0 and abo6 guard cells with and without ABA treatment from three separate experiments and is reported relative to untreated Col-0, with each bar represented by (n > 75) guard cells. C, Stomatal apertures of leaves of Col-0 or abo6 pretreated with either control buffer, 50 µM rotenone for 1 h or 500 nM MitoQ for 3 h and then treated with 20 µM ABA for 45 min. Scale bar: 5 µm. D, Quantification of mt-roGFP2-Orp1 ratio of the entire guard cell following 20 µM ABA, buffer control, or pretreatment with either 100 or 500 nM MitoQ for 3 h followed by ABA treatment for 45 min (n = 65). E, Stomatal apertures of Col-0 and abo6 leaves were quantified at 0, 15, 30, and 45 min after ABA treatment (n > 85 stomata/per reported value) in the presence and absence of MitoQ or rotenone, with the average and standard error of the mean graphed at each time point. All individual values in (B) and (D) were normalized to the average of the control treatment for Col-0 and are displayed on the graph as blue dots with the median shown in red and lower and upper quartiles indicated in black. The P-values for each quantification were generated by two-way ANOVA of the entire time course for each genotype/treatment, followed by Tukey's post hoc tests.

