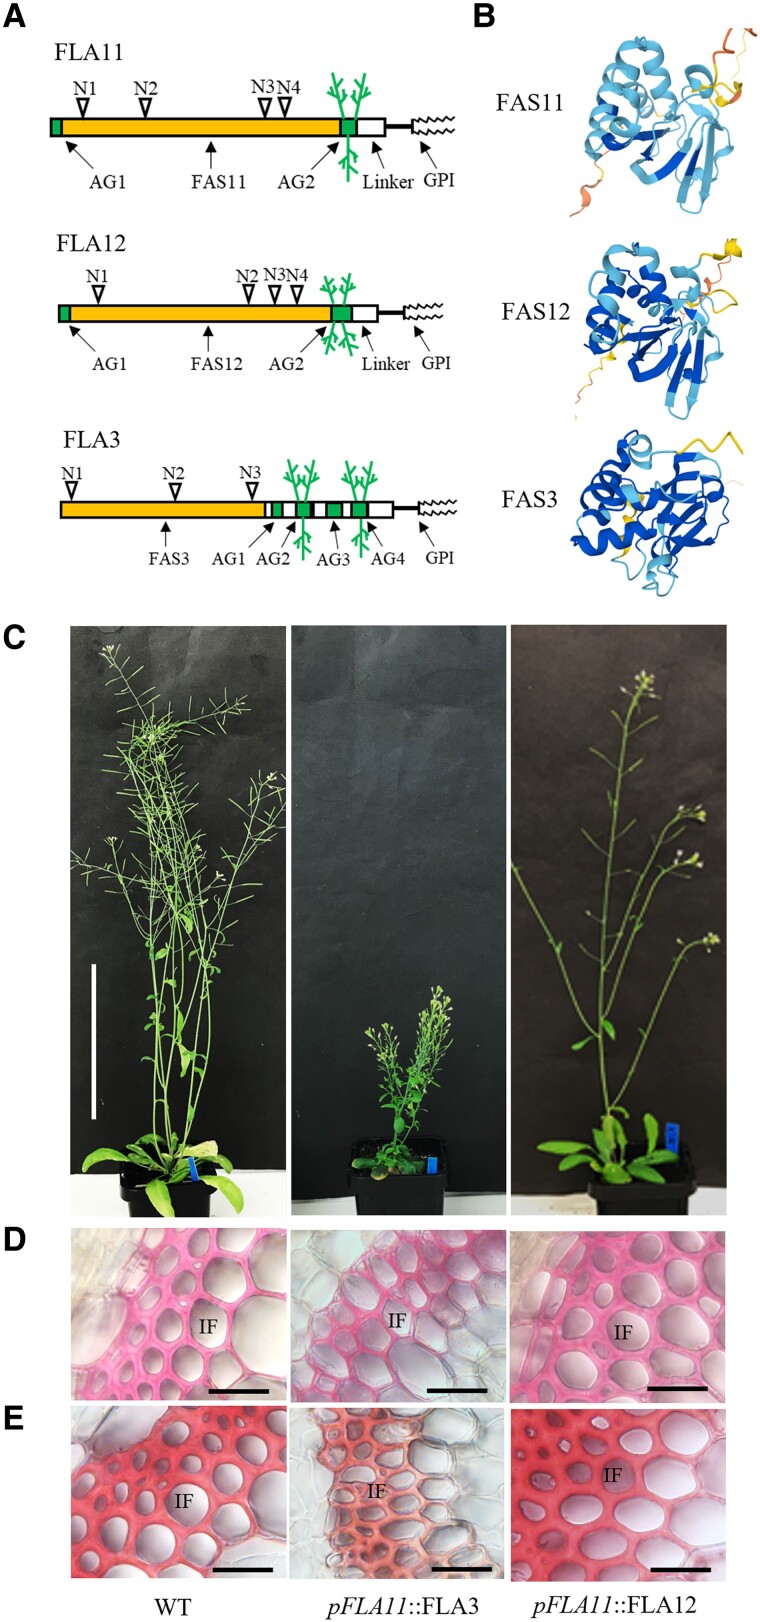
Figure 3.
Comparison of FLA11, FLA12, and FLA3 domain structures and SCW phenotypes. A) Schematic representation of FLA11, FLA12, and FLA3 protein structures with predicted posttranslational modifications. B) Modeling of the FAS1 domain of FLA11 (FAS11), FLA12 (FAS12), and FLA3 (FAS3) using AlphaFold (Jumper et al. 2021) suggests that FAS11 and FAS12 have similar structures that differ from FAS3. C) Representative images of stage 6.9 (Boyes et al. 2001) plant morphology of WT, pFLA11::FLA3, and pFLA11::FLA12. D) and E) Histological analyses of IFs at the base of stems. Sections taken from fresh stems of stage 6.9 plants at 1 cm from the base stained with either phloroglucinol-HCl D) or Mäule stain E) to show cellular morphology and lignin composition. Stems of pFLA11::FLA3 plant show thinner walls compared to WT. Stems of pFLA11::FLA12 plant show similar wall thickness and lignin composition to WT. Scale bar = 10 cm in C) and 20 µm in D) and E).

