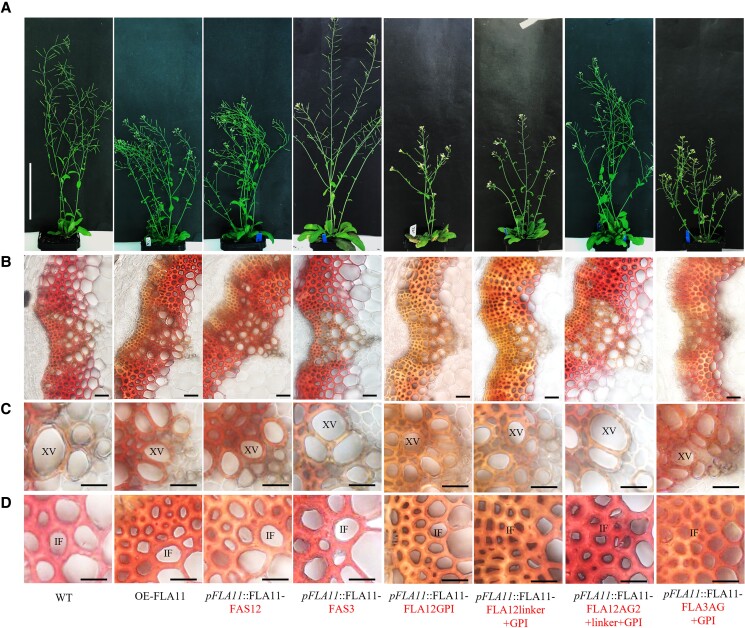
Figure 4.
Comparison of FAS1, AG2, linker, and GPI domain functions for FLA11 regulation of SCW development. A) Representative images of stage 6.9 (Boyes et al. 2001) plant morphology of WT, OE-FLA11, pFLA11::FLA11-FAS12, pFLA11::FLA11-FAS3, pFLA11::FLA11-FLA12GPI, pFLA11::FLA11-FLA12linker + GPI, pFLA11::FLA11-FLA12AG2 + linker + GPI, and pFLA11::FLA11-FLA3AG + GPI (see Table 2 for stem length quantification, Supplemental Fig. S6 for a schematic representation of proteins). B)–D) Histological analyses of the base of stems B), cell morphology of xylem vessels (XVs) C), and IFs and wall lignin composition D). Sections taken from fresh stems of stage 6.9 plants at 1 cm from the base were stained with Mäule reagent. Stems of OE-FLA11, pFLA11::FLA11-FAS12, pFLA11::FLA11-FLA12GPI, pFLA11::FLA11-FLA12linker + GPI, and pFLA11::FLA11-FLA3AG + GPI plant show smaller XV diameters compared to WT, and IFs with red/brown color compared to WT with pink/red color. Other plants show similar XV diameter and IF lignin composition compared to WT. Scale bar = 10 cm in A), 20 µm in B), and 10 µm in C) and D). The domains swapped are indicated in the text.

