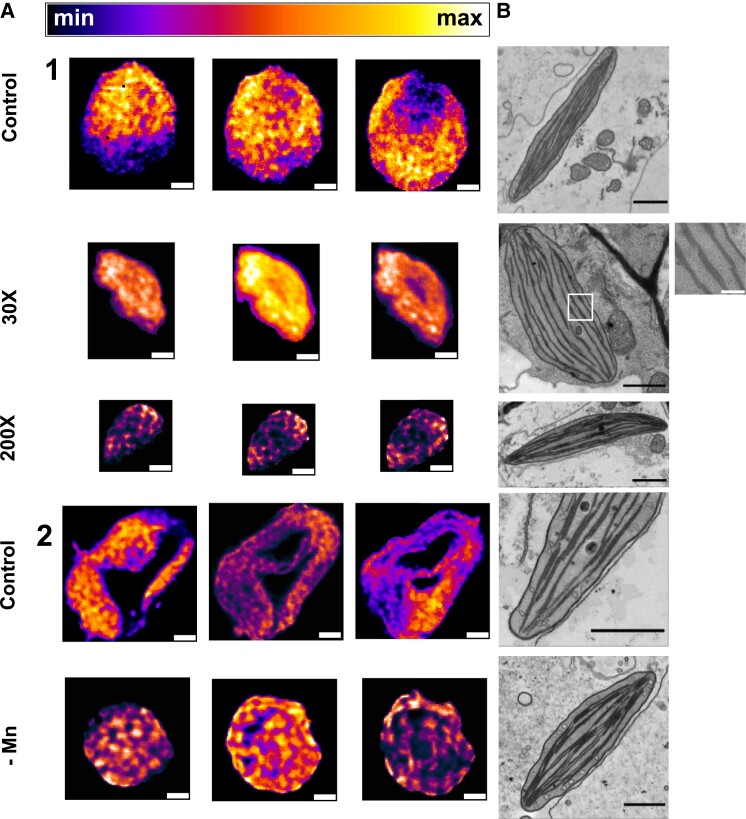
Figure 3.
Organization of chloroplast membranes as evidenced by room temperature in vivo super-resolution chlorophyll fluorescence emission nanoscopy and by TEM. A) Super-resolution fluorescence microscopy. 1) Agar Control, 30 × and 200 × conditions and 2) Starch Control and Starch – Mn. For each culture condition, reading from left to right, the 3 reconstructed fluorescence maps are separated by 300 nm in the axial (z) direction. The false-color scale is represented by horizontal color bar (minimum, black; maximum, white). Scale bar: 1 µm. One chloroplast is represented by a total of 10 chloroplasts analyzed for each condition. B) TEM images. 10–20 chloroplasts were analyzed, exhibiting the same features for each culture condition. Scale bar: 1 µm (except for the digitally enhanced insert, 200 nm).

