

Abstract
Single-cell omics is transforming our understanding of cell biology and disease, yet the systems-level analysis and interpretation of single-cell data faces many challenges. In this perspective, we describe the impact that fundamental concepts from statistical mechanics, notably entropy, stochastic processes and critical phenomena, are having on single-cell data analysis. We further advocate the need for more bottom-up modelling of single-cell data, and to embrace a statistical mechanics analysis paradigm to help attain a deeper understanding of single-cell systems biology.
Introduction
Statistical mechanics emerged in the 19th century in an attempt to explain macroscopic observables of physical systems in terms of their microscopic properties 1, 2. One of the first examples was Maxwell’s kinetic theory of gases, which describes macroscopic features such as gas pressure and temperature in terms of the underlying velocity distribution of gas molecules. Building upon Maxwell’s work, it was generalized and formalized by Boltzmann and Gibbs, who introduced the key notions of macrostate and microstate, which would lay the foundation for statistical mechanics to help explain a wide range of natural phenomena. From describing phase transitions between different states of matter (e.g. superconductivity) 2, to predicting extinction events in ecosystems 3, 4, to modelling protein-folding 5, 6, the framework, concepts and tools provided by statistical mechanics have proved to be universal, profound and of great utility. In light of this universality, the ongoing single-cell revolution 7–9 offers the unprecedented opportunity to apply these same principles to cell biology. Indeed, single-cell technologies make it possible to measure molecular properties of single cells in a genome-wide and high-throughput manner 10, thus inviting statistical mechanics to help bring about a deeper understanding of tissue function (the macrostate) in terms of single cell properties (the microstate). In effect, cell biology and statistical mechanics are finally meeting at a crossroads 11, 12.
One key area of systems biology where synergy between single-cell biology and statistical mechanics has emerged is in relation to modeling Waddington epigenetic landscapes, a simple yet attractive conceptual model for describing cellular development and differentiation, first proposed over 60 years ago by embryologist Conrad Waddington 13, 14. Although we now know that the original model proposed by Waddington only provides a fairly crude description of development 15–17, three foundational ideas remain. First, cells of an organism can be distinguished in terms of their developmental potential to give rise to widely different numbers of other cell types, indicating the existence of a differentiation potency hierarchy, traditionally depicted as the elevation in the landscape, and which hints at the existence of a potential energy function. Second, cells preferentially occupy specific stable regions in the landscape, termed local attractors by Waddington, and which correspond to observed cell types. Third, the landscape is “canalized” into specific basins of attraction, defining low-energy paths that connect attractor states to each other. From a theoretical perspective, all of these landscape features have traditionally been modelled in terms of dynamical systems theory 18–20, and indeed were directly derived from it 21. Although successful in recapitulating principles of differentiation via epigenetic landscape representations 19, 20, the dynamical systems theory framework exhibits many intrinsic limitations, notably the inherent difficulty of solving high-dimensional equations representing realistic gene regulatory networks (GRNs) 22. Consequently, this approach to modelling Waddington landscapes has been limited to differentiation processes that can be reasonably well described by simple low-dimensional regulatory network motifs, such as the PU1-GATA1 system underlying the binary erythroid-myeloid fate decision of common myeloid progenitor cells 19, or the Gata6-Nanog antagonism that underlies the binary epiblast-primitive endoderm fate decision in early mouse development 23–25. Modelling these landscapes for more general, complex and high-dimensional GRNs, whose complete topological structure are not yet known, thus calls for an entirely different approach, both experimentally and theoretically. This new approach is enabled by single-cell omics.
Single-cell omics is altering our understanding of cellular development and Waddington landscapes in two fundamental ways. First, it allows mapping of the dynamic evolution of functional cellular states at single-cell resolution 10, 16, an experimental leap that is fundamentally redefining the Waddington landscape picture in terms of a more general and abstract representation known as a state-manifold 16. Much of this transformation has been enabled by advances in single-cell lineage-tracing technologies 16, 26, which have allowed more precise mapping of single-cell dynamics. Second, single-cell omics allows genome-wide quantification of transcripts and other informative features in large cellular ensembles, and this means that novel, more powerful quantitative modelling approaches, which overcome the limitations of more traditional methods, are now possible. Indeed, in parallel to the many experimental advances, there have been equally important theoretical and computational leaps, with many of these driven or inspired by statistical mechanics.
Here we describe and highlight theoretical and computational advances that are rooted in statistical mechanics, alongside other important computational methods, providing a unified account of their roles in modelling state-manifolds. During the discussion, we make a broad distinction between bottom-up modelling approaches versus more traditional top-down based methods, discussing their advantages and limitations. We also describe how the tools described herein can help address some of the intrinsic challenges of single-cell data analysis, including the high dropout rate 27 and biological noise 28, 29, yet for a more detailed account of the specific computational challenges posed by single-cell data analysis and computational methods to address them, we refer the reader to recent excellent reviews elsewhere 30, 31.
GRN-based modelling of Waddington landscapes
Modelling of Waddington landscapes has long been a key goal of cell biology and molecular medicine, as it embodies the need for a predictive mathematical framework in which to understand how transcription factors orchestrate cellular development and differentiation. The traditional approach to deriving potential energy functions and Waddington landscapes has been through direct modelling of the dynamic changes in transcription factor (TF) concentrations, as determined by a set of non-linear differential equations representing a GRN 18 (Fig. 1a). The underlying GRN has to be known in advance and is often derived from prior biological knowledge and experiments, providing a network representation of the activating and inhibitory regulatory interactions thought to be operating in single-cells. The Waddington landscape itself, embodied by a potential energy function, is in principle then obtained by solving the set of differential equations, yielding a statistical mechanical Boltzmann distribution that describes the probability of finding the cell in specific states (Fig. 1a) However, in practice the solution to these non-linear equations is non-trivial. This is because realistic GRNs define high-dimensional systems that exhibit a large number of stable attractor states, corresponding to observed cell types, and where the dynamics of TF concentrations cannot in general be expressed in terms of gradients of a potential energy function 32. Although theoretical solutions have been obtained that allow inference of quasi-potential functions, thus allowing visualization of Waddington landscapes and successfully capturing known bifurcation dynamics in development (Fig. 1a) 18, 32–36, this approach has been limited to small GRNs consisting of a few TFs and containing only 2 to 3 attractor states 18, 37. Even for relatively small GRNs, the number of unknown parameters requiring prior specification can be considerable 18, 37. Moreover, the modelling derived from a GRN has been unable to predict more complex patterns of cell-fate trajectories, such as state-convergence 16, or multifurcations 38, as observed for instance in the hematopoietic system. An alternative to solving the dynamic equations of a GRN has been to use a Boolean representation whereby gene expression is binarized to an on/off variable and where the dynamics is described by asynchronous update rules specified by the GRN 39, 40. While these Boolean approaches have successfully recapitulated the heterogeneity of gene-expression attractor states in blood stem cells 39, they still depend on prior knowledge of the GRN, which is not available for most systems. More fundamentally, it has also been challenging to explain the “arrow of time” in gene expression dynamics, that is, the spontaneous directional temporal flow of gene expression changes during development 41. As we shall see next, the ability to generate genome-wide single-cell RNA-Seq (scRNA-Seq) data for large numbers of cells 7 has enabled the introduction of novel modelling paradigms that address these limitations.
Figure 1 |. Statistical Mechanical modelling of state-manifolds.
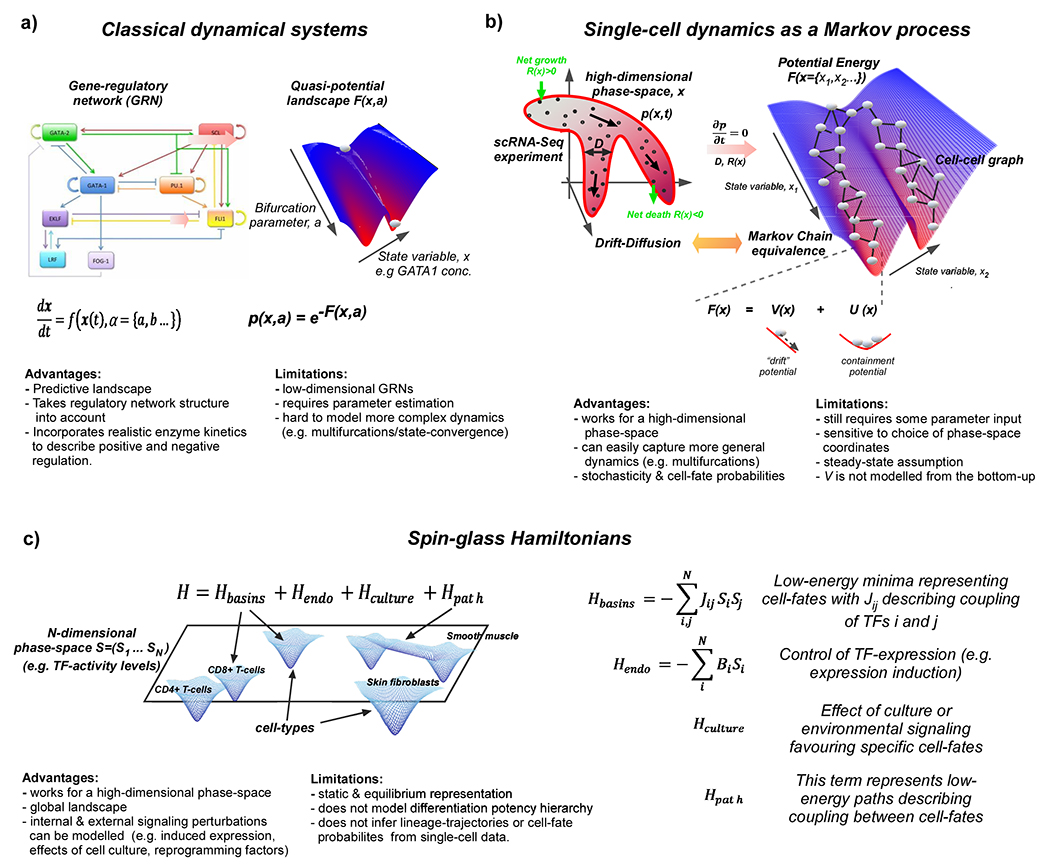
a. The traditional method to modelling Waddington landscapes has been by direct integration of the dynamics of molecular concentrations (e.g. TF-expression levels) as determined by a set of differential equations describing a gene-regulatory network. This solution is embodied by a potential or quasi-potential function F(x,a) allowing visualization of Waddington landscapes and modelling of bifurcation dynamics as a function of various system parameters (labelled as a). The probability of finding a given cell in a given state labelled by a, is then given by the statistical mechanical Boltzmann probability distribution p(x,a), as shown. b. Single-cell omics generates scRNA-Seq data for large numbers of cells, allowing for empirical probabilistic modelling of single-cell dynamics via a class of statistical mechanical PDEs known as drift-diffusion models (see Box-2). These describe the dynamic evolution of the probability cell density p(x,t) in a high-dimensional phase space encoded by x. This equation can be solved for the potential energy function F(x) under steady-state assumptions and with prior specification of parameters describing stochastic diffusion (D) and net birth-death rates R(x) (see Box-2). The solution exploits an equivalence between PDEs and random-walk operators on graphs, and entails the construction of a Markov Chain process on a nearest-neighbor cell-cell graph (as depicted) where the probabilities of the Markov Chain are determined by differentiation potency gradients (encoded by V(x) and stochastic diffusion (encoded by D). c. Spin-glasses are a class of statistical mechanical model that have been used to model systems of many interacting particles and which exhibit many equivalent low-energy attractor states. They have been applied to model a global state-manifold landscape, with each cell-type defining a low-energy attractor state and where the interactions are modelled in a high-dimensional (N large) phase space (labelled here by “spin”-vectors Si, i=1…N) representing Boolean (i.e. on=1, off=−1) regulatory activity of N transcription factors. The Hamiltonian energy function specifying the energy landscape contains a quadratic term in S, which specifies the basins of attraction representing the different cell-types, a linear term in S which can help model the effect of endogenous perturbations (e.g. expression induction), a term reflecting external signalling (e.g. cell culture or intercellular communication effects) and a term describing low-energy paths between cell-fates. The coupling parameter Jij represents the interaction strength, or influence, two TFs i and j have on each other in determining all cell-fate attractor states in the model, and is determined by the Boolean phase space coordinates specifying each cell-type. The state adopted by a cell is determined by minimizing the Hamiltonian energy function. If this function only contains the quadratic term, there are many equivalent low-energy minima, each one corresponding to a distinct cell-fate. The additional terms in the Hamiltonian then tilt the balance in favour of specific cell-fates, depending on whether specific TFs are induced/inactivated and external signalling factors.
State-manifold modelling from scRNA-Seq data
Single-cell dynamics as a stochastic Markov process.
Modelling of the state-manifold from scRNA-Seq data is critical for a deep understanding of cell biology and for realizing the goals of molecular and regenerative medicine. It entails the inference of three major landscape features: local attractor states representing functionally relevant cell types, their elevations in the manifold that influence their differentiation potential, and the low-energy paths, often called lineage trajectories, that connect these attractor states together. Deriving all of these landscape features has been possible through explicit modelling of single-cell dynamics as a stochastic process 42, 43. There are two main reasons why a stochastic process is an appropriate description of single-cell dynamics. First, measuring the transcriptome in the same cell at different positions within the manifold is impossible, since the very act of measurement destroys the cell. Thus, in the absence of lineage tracing, inferring each cell’s past and future lineage trajectory requires a model which probabilistically assigns representative ancestors and progeny of the given cell from the large ensemble of cells measured at earlier and later timepoints (Fig. 1b). Second, molecules within cells undergo truly stochastic rather than continuous changes 28, 31, 44, which means that at the most fundamental level single-cell dynamics is probabilistic. However, it is worth noting that deterministic continuous-like single-cell dynamics may nevertheless emerge from underlying probabilistic processes.
Mathematically, one describes the sampling of single cells in an experiment and the subsequent inference of their cellular states as defining an empirical probability distribution over such states, which for very large numbers of cells will converge to the true (but unknown) distribution. The definition of cellular states requires specification of an appropriate set of phase-space coordinates to use, which may involve analytical steps known as feature selection and dimensional reduction. Once specified, the dynamic evolution of the probability distribution in phase space is complex, yet biological developmental processes are relatively stable and generally do not depend on the specific series of steps that led to a given state, which allows the underlying stochastic dynamics to be viewed as a memory-less Markov process 42. While some recent work suggests that a Markovian assumption may not strictly hold for cellular differentiation 45, it is nevertheless a useful simplifying approximation that allows for an elegant and general formulation of single-cell dynamics in terms of a certain class of partial differential equations (PDEs) known in the Statistical Mechanics literature as drift-diffusion or Fokker-Planck equations (Box-1) 42, 46.
Box 1 |. Drift-diffusion models and Markov Chain equivalence.
Drift-diffusion PDE:
In both time course and static scRNA-Seq datasets, single cells can be viewed as part of a dynamic Markov process, in which cells leave and enter specific states in phase space according to the Chapman-Kolmogorov master equation 180, from which the drift-diffusion (also known as Fokker-Planck) partial differential equation (PDE) model is derived. As applied to single-cell data, the PDE describes how the probability of finding a cell at a given point in state-space changes in time according to (i) a dynamic component called drift (which captures differentiation potency gradients), (ii) a dynamic component called diffusion (which captures stochastic fluctuations around the trajectory), and (iii) a general net birth/death process that models growing or dying cell populations, including spatial migration. The PDE model is:
where p(x,t) describes the probability of finding a cell at time t at position x in phase space, F(x) describes the potential energy function at phase space coordinate x and controls the drift process, D is the diffusion coefficient and R(x) is the net birth-death rate for a cell located at position x in phase space (see Fig. 1b).
PBA (Population Balance Analysis):
PBA is the name given by Weinreb and Klein 42 to the algorithm that solves the above PDE under steady-state conditions , and given estimates for parameters D and R(x) as input. However, PBA refers to the law of mass (probability) conservation, from which the above PDE can be equivalently derived from 33, 42. The net birth-rate R(x) can be estimated from literature or from the expression of genes involved in cell-growth and cell-death (e.g. apoptosis) processes. Variants of PBA that do not require prior estimation of R(x) have recently been proposed 181. The solution of the PDE entails estimation of the potential energy function F(x) that quantifies the state-manifold, and which is made up of two separate potentials V(x) and U(x) so that F(x)=V(x)+U(x). The former describes the potential energy associated with differentiation potency gradients, whereas the latter describes a containment potential that counteracts diffusion to keep cells close to the low-energy paths, and which in general is approximated by 33 (see Fig.1b).
Solution via Markov Chain equivalence:
The full solution of the above PDE exploits a mathematical equivalence to random-walk operators on graphs 182, so that the solution can be derived on the finite state space of a graph. The graph itself is constructed from the scRNA-Seq data, as a k-nearest-neighbour cell-cell graph, where each node is a cell and where the k neighbours of a given cell are the k most similar cells according to a suitable distance metric in phase space. From this unweighted graph, a graph Laplacian matrix is constructed, which describes properties of the random walk on this graph. The potential V(xi) is then obtained as the matrix product V=L−1R. Finally, the Markov Chain solution is obtained by the Arrhenius transition probability formula:
for (i,j) a pair of cells that are connected in the graph, and which equals 0 for pairs of cells that are not neighbours. From this Markov Chain, and given a root-state, pseudotime and cell-fate probabilities can be computed 42.
Solving the drift-diffusion equations: inference of the state-manifold.
By drawing upon equivalence principles linking drift-diffusion equations to random-walks on a graph, Weinreb and Klein showed in a seminal method called PBA (Table 1) how, given a timecourse scRNA-Seq dataset and parameter estimates, the drift-diffusion equation can be solved under steady-state assumptions, to infer the underlying Markov process as a Markov chain on a cell-to-cell nearest-neighbor graph 42 (Box-1, Fig. 1b). The Markov chain itself entails inference of a potential energy function that directly quantifies the elevation and curvature of the state-manifold (Box-1, Fig.1b). One component of this potential energy directly defines the Markov Chain process on the cell-cell graph (Box-1), describing the drift of cells along differentiation potential gradients, and can therefore be used to place cells along a differentiation hierarchy (Fig.1b). From the estimated Markov chain, it is subsequently possible to infer lineage-trajectories, pseudotime 47 and cell-fate probabilities 48, thus subsuming a large number of previously proposed lineage-trajectory inference algorithms 49, including popular tools such as Monocle 47, 50, 51 and Diffusion Maps 52, 53, into one common framework 42. For instance, the Palantir algorithm 54 (Table-1) also builds a Markov Chain on a cell-cell network but does so empirically without an explicit formulation in terms of a PDE. In Palantir, a cell’s potency is approximated by the Shannon entropy (Box-2) over the estimated downstream cell-fate probabilities. Another proposed method is Waddington-OT 43 (Table-1), which formulates the inference of the underlying Markov chain as an optimization problem in optimal transport (OT) theory 55. OT-theory itself can be viewed from the lens of classical dynamics as solving a least action principle whereby the temporal couplings of single cells (i.e. the Markov Chain that determines the lineage trajectories) is such so as to minimize the flow of kinetic energy between neighboring timepoints, with the mass and velocity of the kinetic energy playing the roles of cell-density and potency gradients, respectively 43. Waddington-OT is an extension of this that can capture stochastic diffusion dynamics, as well as cellular birth and death rates, making it very similar to a tool like PBA. While all these tools have been widely tested on timecourse scRNA-Seq data, it is worth pointing out that they are equally applicable to pseudotime-resolved snapshot scRNA-Seq data, as elegantly demonstrated in the case of PBA 46 and Palantir 54.
Table 1 |.
Algorithms and software for quantifying state-manifolds from scRNA-Seq data
| Name | Description | Programming language | Web links | Reference |
|---|---|---|---|---|
| Modelling and visualization of state-manifolds from (temporal or pseudotemporal) scRNA-Seq data | ||||
| PBA | Drift-Diffusion Markov Chain equivalence | Python | https://github.com/AllonKleinLab/PBA | Weinreb et al 42 |
| Waddington-OT | Uses Optimal-Transport | Python |
https://github.com/broadinstitute/wot
https://broadinstitute.github.io/wot |
Schiebing er et al 43 |
| pseudodynamics | Drift-Diffusion PDE | MatLab | https://github.com/theislab/pseudodynamics | Fischer et al 59 |
| Velocyto | RNA-velocity | R & Python | https://velocyto.org | Le Manno et al 146 |
| scVelo | RNA-velocity | Python | https://scvelo.org | Bergen et al 147 |
| Palantir | Markov-Chain based | Python | https://github.com/dpeerlab/Palantir | Setty et al54 |
| varID | Variability/cell-fate transitions | R | https://github.com/dgrun/RaceID3_StemID_2_package | Gruen et al 83 |
| HopLand | Hopfield neural net-based modelling | MatLab | https://github.com/NetLand-NTU/HopLand | Guo et al 35 |
| NetLand | Visualization of Waddington landscapes from GRNs | Java | http://netland-ntu.github.io/NetLand | Guo et al 165 |
| CALISTA | Modelling and visualization tools | R & MatLab | https://www.cabselab.com/calista | Gao et al 156 |
| Estimation of differentiation potency from scRNA-Seq data | ||||
| CytoTRACE | Gene-Count based measure | R | https://cytotrace.stanford.edu | Gulati et al 121 |
| SCENT/LandSCENT | Signalling Entropy based estimation | R |
https://aeteschendorff-lab.github.io/software/LandSCENT/ https://github.com/ChenWeiyan/LandSCENT https://github.com/aet21/SCENT |
Teschend orff et al 101 Chen et al 138 185 |
| StemID/StemID 2 | Transcriptome Entropy | R | https://github.com/dgrun/RaceID3_StemID_2_package | Gruen et al 103 |
| SLICE | Gene-ontology entropy | R | Guo et al 102 | |
| scEpath | Uses a scRNA-Seq based correlation network | MatLab | https://github.com/sqjin/scEpath | Jin et al 127 |
Box 2 |. Entropy in Single Cell Biology.
a). Entropy definitions
There are two common definitions of entropy, one derives from Statistical Mechanics (due to Boltzmann 183) and another derived from Information theory (due to Shannon 184).
*. Statistical or Boltzmann entropy
Given a system composed of n microscopic entities (e.g. atoms, molecules, cells), where each one can be in a finite number of r states, so that ni = number in state i and with , the Boltzmann entropy is defined by the equation
where ln is the natural logarithm, k is a constant, and W is the statistical weight defined as the number of different ways to distribute the n entities among the r states, keeping each ni fixed. For n large (n> >1), this entropy can be approximated as
where is the probability of finding any of the microscopic entities in state i.
*. Information or Shannon entropy
Shannon’s entropy is defined directly in terms of the equation
where pi defines a probability distribution for a discrete random variable taking any one of r values. As with Boltzmann’s entropy, Shannon entropy is maximized when all pi are identical, i.e. when . This corresponds to a state of maximum uncertainty (or least information) as to which state the variable is in.
b). Applications to single cell biology
Within the realm of single-cell omic data analyses, entropy has appeared mainly in two different contexts. One application is to the quantification of heterogeneity or similarity between cells or genes. The other application is to the quantification of differentiation potency.
-
Quantification of heterogeneity or similarity
Given a number of cells (or genes), the similarity of their omic profiles (e.g. expression) can be quantified in terms of their mutual information, which can be expressed in terms of entropy. Specifically, if cells exhibit near identical molecular profiles, knowledge of one profile informs us a great deal about the other profiles, defining a state of high mutual information or low entropy. Conversely, given random profiles, knowledge of one informs us little about any other, which thus represents a state of low mutual information or high entropy. Thus, mutual information has been used as a distance metric between cells (or genes):- Mutual information: Given a set of p random variables Xi (e.g. p gene expression profiles, or p single-cell profiles), their mutual information can be expressed as
which is equal to zero if and only if all Xi are statistically independent. In the above, S(X) is the Shannon entropy of the multivariate distribution . - Covariance entropy: For a continuous multivariate Gaussian distribution specified by a matrix X with covariance matrix Σ, the global heterogeneity can be quantified in terms of the covariance entropy, which can be written as 104:
For p well correlated genes (cells) across n cells (genes), the determinant of the covariance matrix approaches zero and the entropy is low. Entropy is maximized for p uncorrelated genes (cells).
-
Quantification of differentiation potency
Given the transcriptomic profile of a single cell, entropy has been used to quantify the relative potency between cells:- Transcriptome (StemID) entropy: This is defined by the Shannon Entropy of the transcriptomic profile of a cell. In effect, this measures the uniformity of the read count distribution across genes. This entropy definition is used in the StemID algorithm 103 to help assign a stemness index to cell clusters, but can be applied to individual cells.
- SLICE entropy: This is defined by the Shannon Entropy of the Gene-Ontology (GO) activation profile of a cell. This activation profile is defined over GO-clusters (i.e. clusters of genes with similar GO-annotations), and where the activation of each GO-cluster is derived from the expression levels of the genes annotated to that cluster. In effect, this entropy quantifies the uniformity of activation levels over GO clusters. This entropy is used in the SLICE algorithm 102.
- Diffusion or signalling entropy: This is defined by the Entropy Rate of a signalling (diffusion) process in a cell. This definition entails the use of an interaction network (e.g. a PPI network), which is integrated with the transcriptomic profile of the cell, to define a stochastic matrix P with entries pij. This cell-specific stochastic matrix describes a Markov chain diffusion process, and the Entropy Rate (SR) can be thought of as quantifying the efficiency of the diffusion process to “explore” the whole network. This entropy rate is used in the SCENT/LandSCENT algorithms 101, 138 and is formally defined by
where π is the steady-state probability distribution over the network, i.e. it is invariant under a transformation of the stochastic matrix: .
Beyond its clear theoretical importance, methods like PBA or Waddington-OT have enabled critical novel insight into cellular development, fundamentally altering Waddington’s traditional picture of continuously diverging cell-fate transitions. For instance, in the case of myelopoiesis, PBA predicted coupling of dendritic and monocyte progenitors, and separately also of monocyte and granulocyte progenitors, but no granulocyte-dendritic coupling, suggesting two alternative paths for differentiation into monocytes 46. Such “state-convergence” has been confirmed experimentally 56, and has been observed very widely throughout cellular development via lineage-tracing studies 57, 58. Building upon the drift-diffusion model of PBA, a more recent tool called pseudodynamics 59 (Table 1), that integrates scRNA-Seq data with measured or inferred cell population sizes, has also led to important new insights. Importantly, pseudodynamics can improve the estimation of cellular birth and death rates, dynamic processes that can otherwise confound cellular flux gradients associated with differentiation. As a concrete example, pseudodynamics was applied to scRNA-Seq data describing T-cell maturation, naturally revealing two phases in Waddington’s landscape: a low-drift, high-diffusion T-cell receptor (TCR) beta selection phase, followed by a high-growth and high-drift phase, associated with a large increase in T-cells expressing both TCR-alpha and beta 59.
Modelling cell types as local attractors.
It is worth noting that the inference of the state-manifold using tools such as PBA or Waddington-OT does not provide a definition of cell-type. The identification and modelling of cell types from scRNA-Seq data is however a critically important endeavour 60–62, especially for the ongoing Human Cell Atlas efforts that aim to categorize the full repertoire of human cell types 9, 10, 63. From a mathematical standpoint, modelling cell types in terms of stable local attractors in phase space is sensible given that cell types are observed to be relatively stable entities. The local attractors can be visualized as multi-dimensional basins that specify a position (or region) in phase space where the cell-type is defined, as well as a local curvature that reflects cell-type stability.
Traditionally, the attractors representing cell types have been defined as high-density clusters of cells, derived by applying a series of analytical steps to single-cell omic data, which generally may include feature selection, a linear or non-linear dimensional reduction that embeds and visualizes the data in a low-dimensional space , and a choice of clustering algorithm 64–66. For instance, a set of popular clustering algorithms are those based on community detection on cell-cell graphs 67–71, as constructed with tools like PBA, Diffusion Maps or Palantir. A key challenge in defining cell-types is the choice of phase-space coordinates. In addition, each of the steps above often involves a fairly arbitrary choice of parameter values, which depending on the value taken may lead to widely different clusters 72, and hence to plausibly different definitions of cell-type. Thus, more principled ways to define cell types are needed. For instance, selecting the most variable genes is a popular procedure, yet not all highly variable genes may be relevant to the biological cellular processes that define a cell-type. A more sensible choice of coordinates may be to focus on transcription factors (TFs) as these proteins orchestrate cellular development and are fundamental to reprogramming and lineage-conversion experiments 73–75. Their regulatory activity should therefore be more informative and perhaps even sufficient to define the functionally relevant repertoire of cell types. However, estimating regulatory activity from single-cell omic data is challenging. In the case of single-cell assay for transposase-accessible chromatin sequencing (scATAC-Seq) data, DNA accessibility of TF-binding motifs, although highly informative, does not equal regulatory activity 76. In the case of scRNA-Seq data, using TF-expression levels as a proxy for regulatory activity has been successfully applied in the hematopoietic system 77, but is generally a problematic procedure due to their typically low noisy expression and high dropout rate 26. An alternative strategy, illustrated by a method called SCENIC 78, infers regulatory activity by applying a reverse-engineering algorithm 79–81 to infer TF-regulons 82 from the scRNA-Seq data, yet the sensitivity of this procedure is unclear given that the inference is still anchored on TF-expression levels 26, 83, 84. Another alternative approach is to infer regulatory activity from the expression levels of TF-target genes (i.e. both direct binding and downstream indirect targets), as derived from bulk studies (e.g. ChIP-Seq 85 or multi-tissue bulk RNA-Seq datasets such as from the Genotype–Tissue Expression (GTEx) project 86), or from TF-binding motif databases 87, 88. This strategy circumvents the direct use of TF-expression levels, and because it uses a larger pool of TF-targets, it can also tolerate relatively high dropout rates 89, 90.
In addition to the position of the attractors, their curvature may also convey important biological information: for instance, multi-or-bipotent progenitor cells undergoing fate decisions generally exhibit higher levels of intercellular heterogeneity 91–93, reflecting a higher propensity to diffuse more widely around their attractor states, implying a relatively flat or low-curvature basin. In this regard, it is worth noting that methods like PBA 42 and Waddington-OT 43 exploit the typically large number of measured cells to empirically model the curvature of attractor basins. Indeed, in PBA, the potential energy function has a second component representing a ‘containment potential’ that directly describes the curvature of the basin, and which is estimated from the gradients in observed cell-density in phase space, assuming the degree of diffusion is also known (Fig. 1b). However, at present it is still unclear if the curvature of these basins truly reflect cell-type stability, as the underlying interpretation of such curvature is often confounded with other parameter estimation tasks such as the identification of separate cell types 94.
Assuming regulatory activity of TFs can be reliably estimated and that cell types can be unambiguously assigned to well-defined clusters within this regulatory activity phase space, their attractor states can in principle then be modelled in a global phase space using a set of statistical mechanical models known as infinite-range spin-glasses 95, 96 (Fig. 1c). These models are defined by an energy function called a Hamiltonian and in general describe systems of interacting particles that display a large number of stable low-energy states, which in this specific context would correspond to observed cell types. In the spin-glass model, cell types can be represented as defining_high-dimensional ‘spin’ vectors encoding e.g. Boolean (on/off) TF-activity levels, and with strongly interacting or coupled TFs exhibiting similar activation profiles over cell-fates. An appealing feature of the spin-glass model is that it naturally allows for modelling the effects of endogenous and exogenous perturbations (e.g. environmental signaling by a differentiation factor), which breaks the symmetry of the low-energy states, favouring specific cell-fates over others. In such models, expression or signaling induction can be quantified and interpreted as order parameters that control transitions between cell-fates. The ability of a spin-glass to model a large number of different cell types within the same global manifold is important, as this could help predict the outcome of reprogramming experiments, or the presence of unintended cell-fates in specific reprogramming or organoid differentiation experiments 97. For instance, a spin-glass was developed to model a global epigenetic landscape for over 60 cell types and 1000 TFs, and shown to be able to describe known differentiation and reprogramming dynamics 98. However, these models are still crude and don’t incorporate essential features of the state manifold such as differentiation potency or the stability (curvature) of attractors 98. Thus, future work would require generalization of these spin-glass models to incorporate these additional features, which could be important for improving their predictive ability. Alternatively, it has been possible to infer regulatory network relations between attractor states by binarizing TF-expression levels in scRNA-Seq data and subsequently inferring regulatory effects of TFs on each other by studying the specific transitions between cells in each attractor state 77. Such Boolean representations of phase-space have allowed reconstruction of regulatory networks of moderate size (20-30 TFs) and with predictive potential, as shown for Hox and Sox TFs in mesoderm development 77. However, it remains to be seen if such reverse-engineering approaches can be successfully applied to larger regulatory networks and to other developmental systems.
Bottom-up modelling of differentiation potency
Bottom-up versus top-down modelling.
So far, we have described methods that can infer relative potency gradients, cell types, branch points and lineage trajectories, which together allow visualization of the state-manifold. However, an inherent drawback of these methods is the need to impose directionality by hand, i.e. the intrinsic temporal directionality underlying differentiation processes is not automatically inferred. Although this is not a major limitation in timecourse scRNA-Seq studies, it can be a problem in static scRNA-Seq studies or in tissues where differentiation hierarchies are not well established.
To overcome this particular challenge requires an entirely different modelling paradigm, which we shall refer to as ‘bottom-up’ (Fig.2). This contrasts with the ‘top-down’ strategies discussed earlier. The distinction between bottom-up and top-down modelling arises because of the two biological length scales at which we could choose to model differentiation potency in single cells. In the bottom-up approach, differentiation potency of a cell is estimated from knowledge of its underlying molecular network state, using only measurements taken within that cell. Underlying this paradigm is the reasonable assumption that there exists a potential function, which, given some input (e.g. a cell’s RNA-Seq expression and/or chromatin accessibility profile), outputs an approximate value for the cell’s differentiation potency (Fig. 2). Such bottom-up approaches can also be described as being truly model-based, since they require explicit modelling of the potential function. Such modelling can derive from prior biological knowledge and may not require any feature selection or training, which can help avoid overfitting 99 and has other advantages (Fig.2). By contrast, the top-down paradigm considered earlier and exemplified by methods such as PBA, Palantir or Waddington-OT, begins by analyzing all the cells in the given experiment together, to subsequently infer differentiation potency of each cell (Fig.2). Such a top-down approach generally requires feature selection or training, and a dimensional reduction step, all procedures that by definition borrow information from most, if not all, cells in the experiment. Thus, in a top-down approach the potency estimate of a given cell is not just a function of the cell’s transcriptome, but is also dependent on that of other cells. While this can help denoise single-cell potency estimates, it may also be more susceptible to overfitting as it involves many ambiguous parameter choices (Fig.2).
Figure 2|. Paradigms for estimating differentiation potency of single cells.
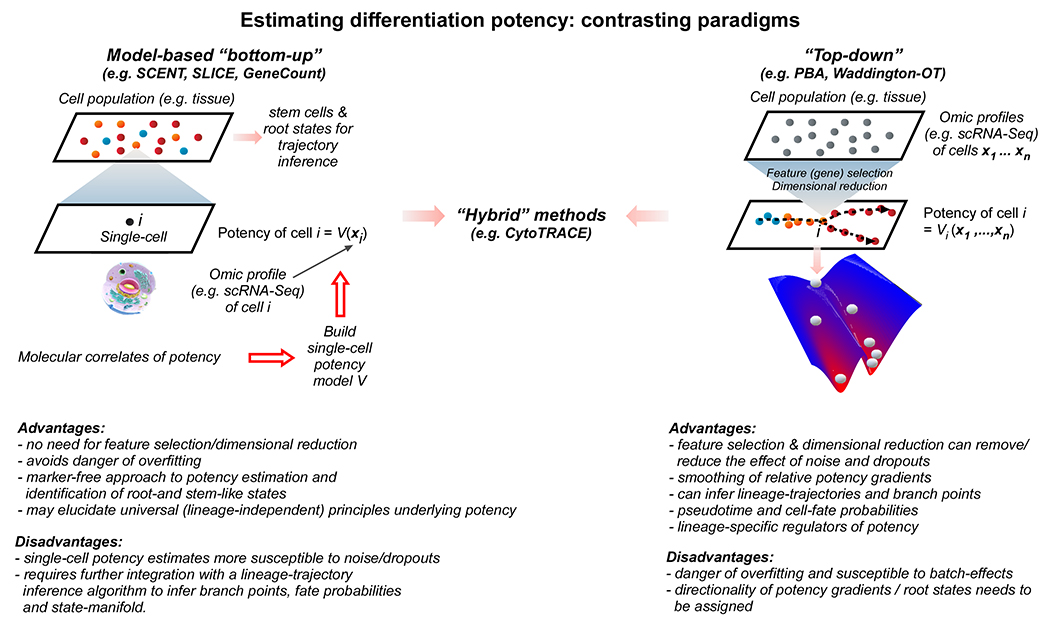
Bottom-up vs top-down paradigms for estimating differentiation potency of single cells, their advantages and disadvantages. Briefly, the bottom-up paradigm involves estimating the potency of each cell using only information measured in that cell, whilst the top-down approach analyses the collective set of cells together to infer each cell’s position in the differentiation hierarchy. The bottom-up approach is more in line with the intuition that a cell’s potency is fully determined by its molecular network state, yet the inference is more susceptible to noise. As an analogy, the bottom-up approach corresponds to using a “ruler” (e.g. SCENT) to measure the “height” (potency) of an “object” (cell) which thus only requires an act of measurement on that object. In the top-down modelling approach no ruler is available, and height needs to be inferred by comparison to other objects of known height, or alternatively only a relative height is inferred.
Bottom-up modelling of differentiation potency using molecular entropy.
A range of bottom-up methods for estimating differentiation potency of single cells have emerged 100–103, many of which rely or are related to the notion of entropy. Entropy is a fundamental concept of statistical mechanics and information theory (Box-2), that has been widely applied in computational biology to quantify not only relative differentiation potency (Box-2), but also various types of biological heterogeneity including inter-cellular 104–106 and epigenetic heterogeneity 107–109. Its relevance for modeling relative differentiation potency is best appreciated by considering known biological correlates of differentiation potential (Fig.3a). One of these is the distribution of expression levels of lineage-specifying TFs, with pluripotency associated with all lineage-specifying TFs being expressed at a similar low ‘basal’ level, thus defining a state of high entropy 110–112. From a signaling random-walk perspective, pluripotency thus reflects a high level of choice or uncertainty (i.e. entropy) as to which lineage-trajectory a random-walker would choose to move along 100 (Fig.3b). In a well-differentiated cell, most of these lineage-specifying TFs are switched off except for the relatively few that define the cell-type and which are highly expressed, defining a state of low entropy. Another correlate of potency is the openness of chromatin (Fig.3a) 113, 114, with an open architecture allowing more frequent protein-protein and protein-DNA interactions, reflecting the need of high-potency cells to express a larger number of TFs and downstream targets 115, albeit all at a low basal level. Thus, basal expression, chromatin loosening and stemness are all intimately connected 115, and together suggest that signaling entropy, if quantifiable, could be a useful measure of differentiation potency (Fig. 3b).
Figure 3 |. Single cell potency and molecular entropy.
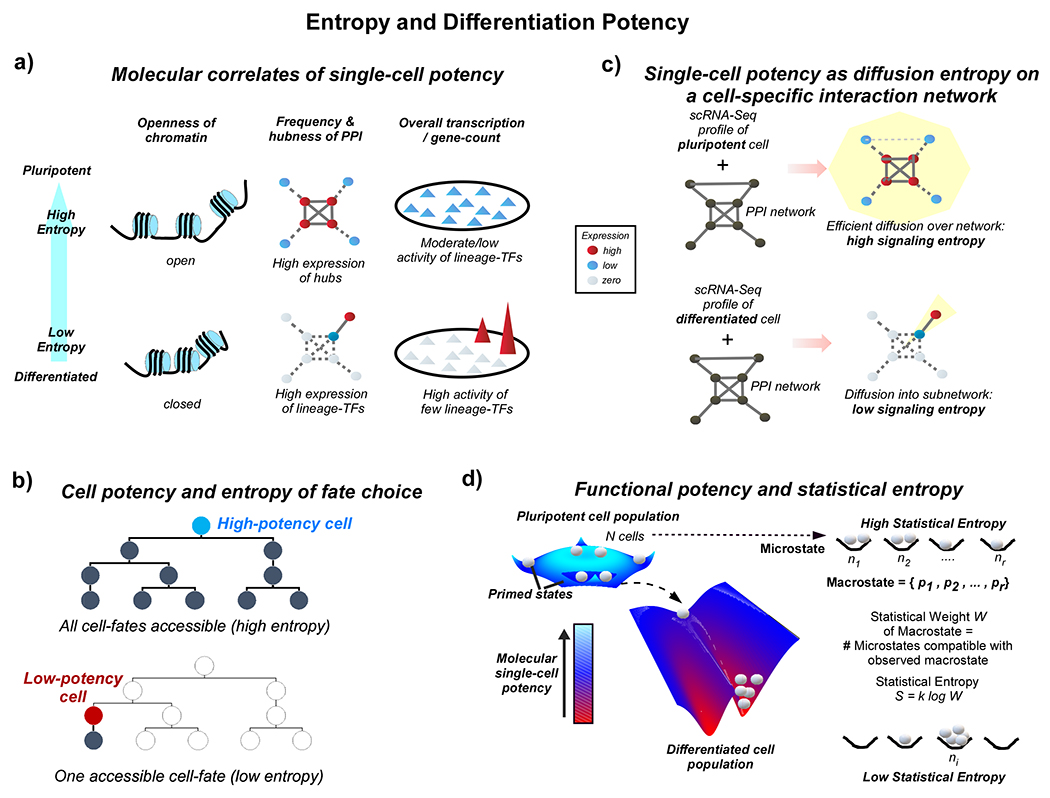
a. Examples of molecular correlates of potency, including the openness of chromatin, frequency and hubness of protein-protein interactions (PPIs) and overall number of expressed genes (gene count). A more open chromatin facilitates more PPIs and on average highly expressed proteins define hubs. A more open chromatin is also associated with a higher number of lineage-specific transcription factors (TFs) and downstream targets being all expressed at a similar low basal level. Here, the expression level of the TFs and their gene-targets is less important than the numbers of TFs being expressed, as only the latter determines the ability to quickly and fully turn on TFs and their downstream targets in response to external stimuli. Thus, stemness correlates with molecular entropy. Top panels depict the case of a pluripotent cell (high entropy), lower panels depict the case of a differentiated cell (low entropy). b. Depiction of cell potency as signalling entropy in a developmental tree, reflecting the uncertainty or choice in accessible cell-fates. c. A more detailed interpretation of cellular potency as a diffusion or signalling entropy in a PPI network. A scRNA-Seq profile of a cell is overlayed onto a high-quality cell-type independent unweighted PPI network, resulting in a weighted “signaling” network, where edge weights reflect the average expression of its nodes and therefore interaction probabilities. Solid lines represent high interaction probability, dashed thick lines intermediate probability, dashed thin lines weak probability and no edges indicate zero probability. This weighted network defines a cell-type specific stochastic matrix and Markov Chain. In the case of a pluripotent cell (top panel), where networks hubs exhibit high expression and lineage-specific TFs (non-hubs) are only moderately expressed, the signalling or diffusion entropy which measures the efficiency of the diffusion over the network is high. In the case of a differentiated cell (lower panel), most pluripotency hubs and lineage-specific TFs are not expressed, except for a few lineage-specific TFs (only one is shown for convenience) that are highly expressed. Signalling/diffusion entropy is low, because a non-central part of the network is highly activated drawing and locking in signalling flux into that subnetwork. Mathematically, signalling/diffusion entropy is calculated as the signalling entropy rate of the stochastic matrix/Markov Chain (see Box-1b for the mathematical formula). d. Quantification of functional potency in terms of Statistical Boltzmann entropy S. Depicted are two cell populations, a pluripotent one where cells are distributed fairly equally between a true pluripotent state and primed states associated with e.g. multi-lineage priming, as observed experimentally. This defines a state of high Boltzmann entropy, as there are many ways to distribute cells (each cell has its own identity) among potency states whilst preserving the global probability distribution. This probability distribution can be viewed as a microstate and as the defining feature of functional pluripotency. For a differentiated cell population, most of the cells are found in the same low potency state, except for a smaller number of progenitor cells, defining a state of low Boltzmann entropy.
One method to draw on these principles is SCENT (Table 1) 101. SCENT estimates differentiation potency by first integrating the genome-wide expression profile of a given cell with a protein-protein interaction (PPI) network 116, 117, invoking the mass action principle to quantify the likelihood of PPIs in a cell-specific manner, and subsequently approximating potency as the signaling entropy rate (Box-2) of a random walk on the cell-specific network (Fig. 3c) 100, 101. Importantly, the association between entropy rate and a cell’s potency is strongly dependent on the hierarchical and approximately scale-free nature of PPI networks 118–120, as these networks contain signaling hubs, which tend to be overexpressed in the more potent cells (Fig.3c) 118. Other differentiation potency models are based on the notion of transcriptional entropy and include methods such as StemID 103 and SLICE 102 (Box-2, Table 1). In the case of SLICE, genes with similar GO annotations are placed in GO-clusters, and a Shannon entropy is estimated over the GO-cluster activation profile (Box-2). Another important potency model is the number of expressed genes or gene-count 121 (Fig.3a), which is closely related to transcriptomic entropy and which has been shown to correlate with the degree of chromatin loosening 121. A recent comparison between SCENT, SLICE and StemID concluded that SCENT was more robust, driven by the noted correlation between potency and hub overexpression 101, 122.
This comparative study also revealed that specific network hubs encoding ribosomal components are robust markers of differentiation potency, an association also seen in bulk expression data, and which is independent of cell proliferation 101, 122. These observations have strong support from scRNA-Seq studies in other lineages and species including mouse and zebrafish 123, 124, and suggest that the average expression level of ribosomal genes in a cell may be a universal, i.e. lineage-independent, measure of potency, reflecting a cell’s need to express a given number of lineage-specific transcription factors and downstream targets. Thus, while the utility of PPI networks has been widely debated in computational biology generally 125, the specific application to potency estimation reveals that particular robust network features can be useful and provide unique biological insight 125.
Hybrid top-down/bottom-up methods to potency estimation.
Another set of methods borrow elements of a bottom-up approach but require data from other cells to estimate potency of any given cell, which we therefore refer to as hybrid methods. One of these, developed by Gulati et al, is called CytoTRACE 121 (Table-1). This method is based on the gene-count measure, but given the noise in scRNA-Seq data, Gulati et al aimed to increase robustness by modifying it in two ways. First, a gene selection step is included to identify genes for which expression correlates with the gene-count per cell, as computed over all cells in the experiment. A geometric average expression of these genes is then smoothed using corresponding estimates of transcriptionally similar cells. The resulting measure, termed CytoTRACE, exhibits improved robustness over measures such as SCENT, StemID and SLICE, owing in part to the fact that CytoTRACE exploits the intercellular variation across differentiation stages in the experiment, to smooth potency estimates accordingly. Although this smoothing-step can help remove biological noise, it could in principle also have the undesirable consequence of diluting out biologically relevant heterogeneity, as with primed states in a stem-cell population 11, 15, 126. In CytoTRACE, gene-selection is study-specific, which can help identify lineage-specific regulators of potency 121. By performing a meta-analysis over 40 scRNA-Seq studies, the gene-count signature on which Cytotrace is based was found to be strongly enriched for ribosomal components 121, consistent with SCENT, and thus demonstrating that universal lineage-independent features of potency can also be identified by averaging over many studies. Another hybrid method is scEnergy/scPath 127, which is conceptually similar to SCENT, but which instead of utilizing a PPI network, tries to infer a co-expression network from the scRNA-Seq data itself, a procedure which requires information from all cells in the experiment. While reverse-engineering networks from data has been a fruitful endeavour 82, 128, inferring such correlation networks from scRNA-Seq data can be problematic due to covariation patterns being naturally more susceptible to the high dropout rate and noise 30, 84, 89. Thus, further investigation is needed to assess the relevance of such correlation networks for the specific task of potency estimation.
Identification of root and stem-like states in scRNA-Seq data.
An important application of bottom-up modelling is to the problem of identifying root states in scRNA-Seq data.. Root-states often represent stem-or-multipotent progenitor like cells, and their identification is critical for correctly inferring pseudotime and cell-fate probabilities 54, for understanding differentiation hierarchies within a tissue 129–132, and ultimately for regenerative medicine purposes 133, 134. Although in differentiation timecourse studies 135 97, potency gradients are generally well correlated with the timepoint itself, and therefore root-state identification presents less of a problem, the often ambiguous choice of root-state can greatly influence lineage-trajectory inference estimation 54. In static scRNA-Seq studies, where all cells are profiled at the same timepoint 9, 10, 136, root-state identification poses a much harder problem. Here, the traditional approach has been to rely on the expression levels of known stemness or progenitor markers, yet these markers are often imperfect or controversial 110. Compounding this, the high-dropout rate of scRNA-Seq data 27, 137 can often preclude the use of specific markers 130, 138. Traditional stemness markers may also not be sufficiently accurate or may not even exist 110. Thus, there is a need for marker-free strategies that can unambiguously identify root-states, even in the background of high noise and dropout rates.
Entropy-based bottom-up methods described earlier allow in principle such stem-like root states to be identified, and can be directly integrated with existing lineage trajectory inference algorithms 49, 51, 121, 139. For example, SCENT was applied to thousands of scRNA-Seq profiles from the human mammary epithelium, and subsequently integrated with diffusion maps 52, 139 to unambiguously identify a root state which exhibited all the hallmarks of stem and bipotent-like mammary cells 138, a cell-state not identifiable using a traditional marker expression approach 130. Similarly, CytoTRACE was integrated with Monocle-2 51 to help identify the correct root state in early hematopoiesis, out of an initially large and ambiguous pool of 23 root candidates 121. Differentiation potency models have also shown value in delineating differentiation hierarchies and identifying stem-like cells in the context of diseases such as cancer, as shown in the context of Langerhans cell neoplasms 140 and prostate cancer 101, 141. CytoTRACE was also applied to FACS-sorted luminal cell populations from breast cancer patients, validating a luminal progenitor population of higher potency and identifying GULP1 as a novel gene driving tumorigenesis 121. In an application to hematological cancer, StemID 103 was used to confirm depletion of leukemia stem cells in Kat2a KO acute myeloid leukemias 142.
Statistical entropy of cellular ensembles, multi-lineage priming and functional potency.
Single cell (i.e. bottom-up) potency measures also allow quantification of the heterogeneity in differentiation potency within cellular ensembles, and can thus help with the identification of primed states, such as those associated with multi-lineage priming in pluripotent and multipotent cell populations 15, 26, 38. For instance, SCENT was applied to a pluripotent cell population, revealing cells of marginally lower potency that expressed higher levels of neural stem cell markers, suggesting priming into the neural lineage 101. More generally, heterogeneity of functional states in a pluripotent cell population has been proposed as the defining feature of functional pluripotency 11, and therefore, single-cell potency measures could help quantify this level of functional potency in a general cell population. Bottom-up potency measures could also be used to quantify the multi-fork and continuous-like differentiation dynamics, as recently observed in hematopoiesis 38 and that have utilized groundbreaking lineage-tracing based cell-fate mapping technologies 26. From a statistical mechanical perspective, functional potency could thus be viewed as a macrostate encoded by a probability distribution over functional cellular states in phase space, and quantifiable using Boltzmann entropy (Box-2, Fig.3d). This provides a fresh theoretical perspective on the long-standing phenomenon of regulated stochasticity, whereby an individual pluripotent or multipotent cell exhibits the ability to dynamically explore phase space in a seemingly stochastic manner, yet allowing subsequent cell-divisions to predictively reconstitute the full expression heterogeneity of a pluripotent/multipotent population 143–145. As a result of this regulated stochasticity, cells will transit between specific meta-stable attractor states associated with multi-lineage priming (Fig.3d), but in doing so will also transiently explore a wider range of states, driven by an open chromatin architecture that permits random variation in expression 15, 38. Thus, single-cell potency measures provide a link between a cell’s regulatory network state, which endows the cell with the ability to transiently explore these meta-stable states, and the regulated heterogeneity of primed states in the cell population.
Bottom-up modelling using RNA velocity.
A limitation of bottom-up based approaches is that these methods require further integration with top-down algorithms to infer other features of the state-manifold such as branch points and lineage trajectories. One exception to this however, is a bottom-up approach based on the concept of RNA-velocity 146 (Table-1). While not statistical mechanical in origin, RNA-velocity is based on a dynamic model of transcription, formulated for each gene in a cell, that takes the transcription, splicing and degradation rates into account. RNA-velocity hinges on the observation that for genes being transcriptionally upregulated, their mRNAs will be skewed towards nascent, unspliced transcripts, whereas for downregulated genes the skew is towards mature, spliced transcripts. By comparing the ratio of unspliced to spliced transcripts to the ratio expected under steady-state assumptions, RNA-velocity can infer the direction of transcriptional change of each gene in a given cell. Although RNA-velocity conforms to a bottom-up modelling paradigm, it is worth noting that the parameter estimation task in RNA-velocity does rely on a fraction of cells being in a steady-state condition. A generalization of RNA-velocity called scVelo, which does not require such steady-state assumptions, and which solves the kinetic models for each cell separately has recently been proposed 147. The end result of these methods is assignment of a velocity vector to each individual cell, which can be graphically represented as a velocity field. This field quantifies the direction in phase space in which each cell is moving, and allows potency gradient flows, lineage trajectories and bifurcation dynamics to be inferred 146. For RNA-velocity to be useful, the sampling of cells in time must be on a temporal scale matched to the half-life of mRNA, which can range from hours to days. Another caveat is that RNA-velocity may capture other dynamics not associated with potency gradients, such as for example variation associated with the cell-cycle, thus requiring additional processing to extract components relevant to modeling lineage trajectories. As with the entropy-based methods, RNA-velocity has also led to important biological insights in cancer. For instance, in glioblastoma, RNA velocity was used to show that mesenchymal and proneural glioma stem cells are just extremes in a one-dimensional continuum of hybrid mesenchymal-neural stem-cell states 148.
Statistical mechanics of cell-fate transitions
So far, we have seen how statistical mechanical concepts have enabled improved modelling of state-manifolds from single-cell data. As we shall next, they also offer a powerful bottom-up perspective for modelling cell-fate transitions on these manifolds, which can help provide novel insight on the molecular mechanisms underlying these transitions 149. In this regard, it is worth noting again that in Waddington’s original landscape, cell-fate transition dynamics has traditionally been modelled in terms of specific GRNs 18, which is appealing because a GRN models relevant molecular interactions within the cell, in line with a bottom-up modelling paradigm. However, as also mentioned earlier, differential equation-based modelling is limited to small GRNs, and therefore difficult to generalize to the higher-dimensional phase space of realistic GRNs. Top-down modelling approaches such as PBA 42 and Waddington-OT 43 can overcome this limitation, but conversely do not model the regulatory interactions within individual cells and may only provide limited mechanistic insight. Taking a statistical mechanical perspective and viewing cell-fate transitions as a form of critical phase transition (Box-3), provides a much-needed bottom-up approach to modelling these transitions, effectively extending the GRN-based approach to a higher dimensional phase space.
Box 3 |. Cell-fate transitions as critical phenomena.
Critical phase transitions, critical points and universality
A large class of phase transitions are “critical” in the sense that there exists a critical point at which the phase transition behaviour of the system is “universal”, meaning that macroscopic properties of the system are determined mainly by long-range microscopic interactions, largely transcending the details of the short-range interactions that usually define the system. That is, at and near the critical point, properties of the system only depend on the global pattern of microscopic interactions, and are not dependent on the details of the microscopic elements themselves, which means that widely different systems can exhibit similar phase transition behaviour.
Correlation length power law
Denoting by tc the critical parameter, and by t* the critical transition point, for a large class of phenomena undergoing critical phase transitions, a correlation length observable with can be shown to increase as (i.e. as t → 0) according to a power law
where v is the critical exponent (a positive number). For an infinite system this means that the correlation diverges at the critical point itself, but for real-world systems that are finite in size, the correlation remains finite and is maximized at the critical point.
Pitchfork and Saddle-Node Bifurcations
Many cell-fate transitions are characterized by an abrupt change in accessible local attractors within phase space and are often described by a class of bifurcation known as subcritical pitchfork bifurcation 18, 20. In this type of bifurcation, and in response to some extracellular signal, a stable multipotent attractor state gradually becomes destabilized by the emergence of additional meta-stable states representing cells primed to differentiate into specific downstream lineages. At the bifurcation or critical point, the original multipotent attractor state effectively disappears giving rise to two or more strongly stable attractor states representing the different cell-fates. A saddle-node bifurcation is another type of dynamical bifurcation associated with the emergence of an unstable “saddle-node” state in phase space, often termed a tipping point, and which has been used to describe cell-induction processes 18. Beyond the tipping point, dynamics is no longer reversible. For both types of bifurcations, the approach to criticality is characterized by increased variance and covariance in expression between genes that are relevant for the specification of the downstream fate(s).
Dynamic Network Biomarker (DNB) formalism
This is a heuristic formalism derived from dynamical systems theory as applied to a high-dimensional and general gene regulatory network, that allows construction of gene modules G from relevant omic gene expression data, and which can be used to study critical behaviour 155. Gene modules are constructed using feature selection and clustering algorithms to infer gene-clusters at each timepoint and over all timepoints in a typical temporal gene expression study. A gene module exhibiting hallmarks of a cell-fate transition, i.e. increased covariation, is called a DNB and can be identified using a criticality index (see below) 155. DNBs may contain key regulatory factors controlling cell-fate and/or be strongly enriched for direct and indirect targets of these regulatory factors.
Criticality indices
In the context of cell-fate transitions, a number of different criticality indices (CI) that capture the qualitative increase in covariation have been proposed 92, 93, 155. In all cases, the CI is defined for a particular subset G of genes, and for a particular timepoint t. One strategy 155 defines CI(G,t) as
where SD and PCC are the standard deviation and absolute Pearson Correlation Coefficients, and where 〈 〉G,t indicates the average taken over genes or pairs of genes in the subset G using cells collected at timepoint t. In the above, 〈 〉o,t means the average taken over pairs of genes with one gene in subset G and the other belonging to any other gene not in G. Recognizing that cells exhibit lower correlations as the critical point is reached, an alternative index has been proposed 92 as
where the denominator now involves the average of absolute Pearson Correlations between pairs of cells at timepoint t. In essence, the CI tracks two contrasting dynamic patterns of expression covariation as the bifurcation point is approached: on the one hand, an increased covariation in gene-space, reflecting the increased variance and correlation between genes specifying the same lineage, and on the other, a reduced covariation between cells (i.e. increased intercellular heterogeneity), reflecting e.g. multi-lineage priming (see Fig.4a).
Cell-fate transition as a critical phase transition.
A large class of phase transitions in nature are ‘critical’ in the sense that there exists a critical point at which the properties of the system change abruptly in a manner that is only dependent on the global pattern of microscopic (e.g. molecular) interactions (Box-3). Two profound principles underlying critical phase transitions make them highly relevant to describing cellular differentiation. First, systems undergoing critical phase transitions do so because of underlying abrupt changes in their microscopic interaction patterns 150. Cellular differentiation, which is characterized by a drastic rewiring of active regulatory interactions is a clear example 151, 152. Second, specific macroscopic observables from widely different systems may exhibit the same functional behavior as the critical points defining the phase transitions are approached 3, 153, 154, a phenomenon broadly referred to as universality (Box-3). One of these macroscopic observables is the correlation length, which exhibits a universal power-law behavior, in theory diverging or becoming maximal at the critical point itself (Box-3). Thus, by measuring this correlation length in cellular systems as a function of relevant system parameters, one can in principle identify the critical points at which cells undergo fate-transitions. Chen and colleagues 155 showed how to construct these correlation length observables from empirical high-dimensional omic data and for cellular systems that undergo the type of dynamic bifurcations (e.g. pitchfork bifurcations 18, 20) that are normally associated with cell-fate transitions (Box-3, Fig.4a). Underlying their construction is the inference of a dynamic network biomarker (DNB), reflecting interaction patterns of specific genes within the complex high-dimensional GRN, and whose covariation increases as the bifurcation or critical point is reached (Fig.4a, Box-3). Furthermore, a criticality index that captures the increased covariation near the critical point can be constructed to allow detection of the impending phase transition (Fig.4a, Box-3). By studying dynamic covariation patterns as opposed to only dynamic changes in TF expression, the DNB formalism can help overcome inherent challenges of single-cell data such as the high dropout rate and low sampling sparsity near branching events 83.
Figure 4 |. Critical phenomena in development and disease.
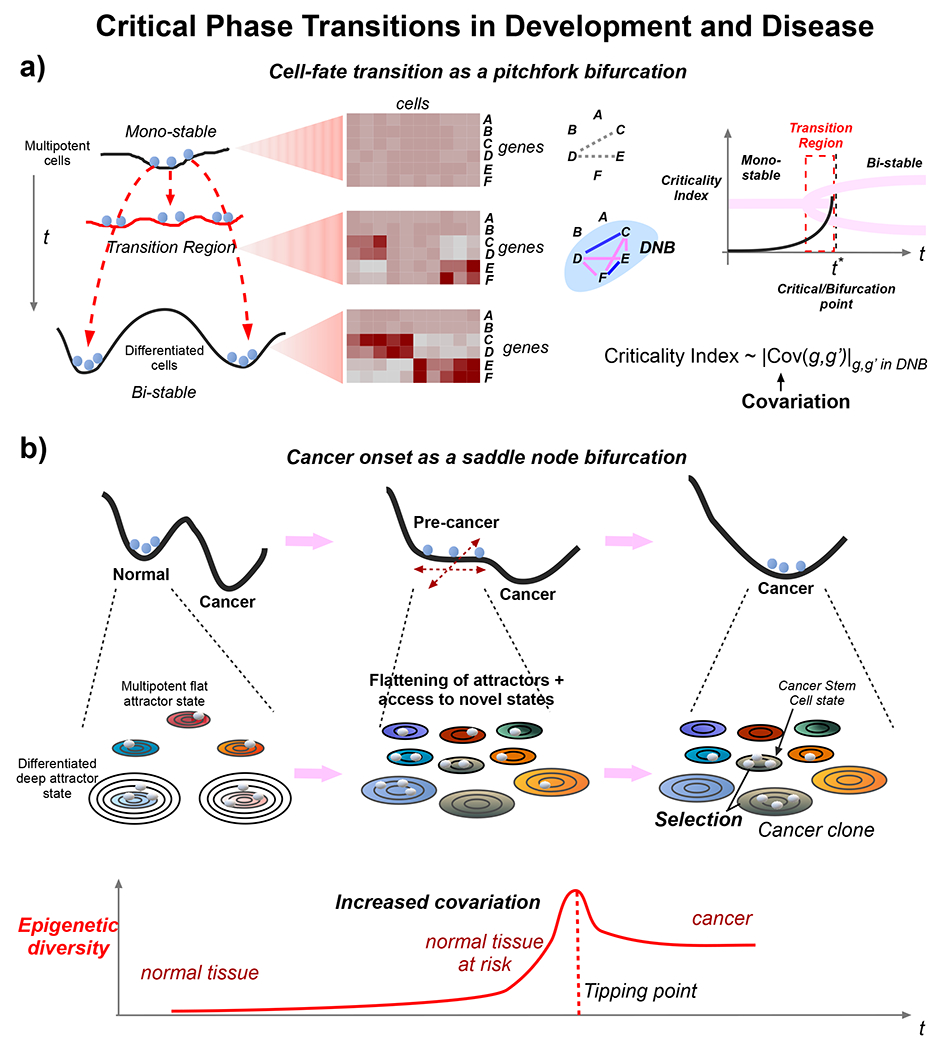
a. From a dynamical systems viewpoint, cell-fate transitions are described by dynamical bifurcations. Depicted is an example of a subcritical pitchfork bifurcation where a bipotent cell undergoes differentiation into one of two differentiated states. In the transition region the bipotent state becomes gradually destabilized while two meta-stable primed states emerge, defining a temporary region of tri-stability. Heatmaps of gene expression across cells and genes in the mono-stable, tri-stable and bi-stable regions are shown to highlight how particular genes exhibit increased covariation as the critical transition point is reached, reflecting increased interactions within a complex GRN. A universal principle of statistical mechanics predicts the existence of dynamic network biomarker (DNB), for which a criticality index measuring the covariation strength of gene pairs (g,g’) in the DNB (Cov(g,g’)) can be computed, and which increases as the critical phase transition point is approached. b. The transition of normal to cancer tissue can also be viewed as a critical phase transition and specifically as a saddle-node bifurcation in an appropriate dimension of phase-space (shown here along the x-axis as a one-dimensional space with the y-axis representing potential energy, top panel). Adding further phase-space dimensions to capture a more complete state-manifold, cancer progression can be seen as a gradual destabilization (lack of differentiation) of previously stable differentiated attractor states, and simultaneous emergence of new meta-stable attractors, increasing the epigenetic state diversity/mosaicism in a cell population. Each attractor is depicted as a series of concentric ellipses representing contours of stability with more circles indicating more stable attractors. Attractors containing cells indicate states present in the cell population (middle panel). Statistical mechanics predicts the existence of a DNB whose genes exhibit increased covariation due to the wider exploration of phase space states, and whose criticality index is a direct measure of the underlying epigenetic mosaicism. Cancer itself is characterized by the selection of a specific cancer clone that outgrows other precancer states, following e.g. acquisition of an oncogenic growth promoting driver event. As a result of this selection, epigenetic mosaicism drops, but still remains higher compared to the normal state (lower panel).
Experimental verification that cell-fate transitions do indeed exhibit the hallmarks of critical phase transitions and that criticality indices can be used to identify key regulators or markers controlling cell-fate, has come from a number of recent scRNA-Seq studies 91–93, 156. In an experiment differentiating induced pluripotent stem cells (iPSCs) into induced cardiomyocytes, a criticality index was used to identify cKIT expression as a predictive marker for differentiation into the mesoderm cardiomyocyte lineage, as opposed to the competing endoderm lineage, thus providing a molecular basis for improving the efficiency of such reprogramming protocols 91. The phase transition model can also more naturally explain phenomena such as the presence of rebellious cells, i.e. cells that due to the destabilization of the multipotent progenitor state, can stochastically diffuse towards an unintended cell-fate, even in highly skewed differentiation protocols 92. While a limitation of these initial studies is that they only profiled a relatively small number of genes selected based on their perceived importance in the process under study 91–93, recent genome-wide studies have provided further evidence for a phase transition model 83, 157. For instance, using scM&T-seq 158 to simultaneously profile the methylome and transcriptome in single cells, it was shown how multi-lineage priming and exit from pluripotency is associated with high intercellular variability in gene expression and enriched DNA methylation at putative enhancer sequences 157.
Early warning signals for disease onset and progression.
An important application of the phase transition model is to disease risk prediction and prevention. Critical points underlying phase transitions often reflect underlying saddle-node bifurcations, which are irreversible, and therefore often referred to as tipping points 3 (Box-3, Fig.4b). They have been proposed as a model for disease onset and progression, describing the switch between healthy and disease states (Fig.4b) 155. Thus, the increased covariation in molecular observables that accompanies the approach to criticality, provides an attractive framework in which to detect imminent tipping points. For instance, tipping points could occur in stages immediately prior to disease onset, where such onset could be avoided through appropriate preventive action 154. In addition, the increased covariation and DNB could be used to identify disease risk biomarkers 155. We stress that this represents a departure from the more common biomarker identification paradigm based on only seeking dynamic changes in average levels, and therefore represents a paradigm shift in how to select biomarkers.
A major challenge in applying this tipping-point concept to genomic medical data is the requirement, in theory, of many longitudinal measurements in the same individual. Although such a longitudinal approach is infeasible for diseases originating in inaccessible tissues, the DNB formalism can however also be applied ‘cross-sectionally’ across a training cohort of individuals from different disease stages to identify a DNB that can subsequently be used to predict disease risk in independent cohorts 155. For instance, such a strategy was used on bulk DNA methylation data to predict the prospective risk of cervical cancer 3 years in advance of diagnosis 159. In this context, the increased covariation is between specific CpGs in the DNB and in stages prior to cancer diagnosis, reflecting an increased epigenetic mosaicism within the cell population, which is maximal immediately before cancer onset 159, 160 (Fig.4b).
Statistical mechanical models exhibiting critical phase transitions have also been explored in a disease context at the single-molecule level 107. By modellingspatially correlated DNA methylation patterns as derived from single molecule reads, in terms of a Boltzmann probability distribution with a potential energy function given by a, one-dimensional Ising-spin model, it has been possible to identify critical gene loci where alterations in DNA methylation could underpin an increased functional epigenetic plasticity and risk of cancer 107, 161. The same Ising-spin model was used to infer that the genome is subdivided into regions of consistently low or consistently high methylation entropy, demonstrating that the boundaries of these “entropy-blocks” coincide with those of topologically-associated domains (TADs) 107. This demonstrates how statistical mechanical models can lead to novel insight, in this case by deriving epigenetic entropy landscapes that associate with chromatin architecture, and elucidating principles by which these landscapes are altered in disease.
Future outlook and perspective
Statistical mechanics has already provided clear computational and conceptual advances when analyzing and interpreting single-cell data, yet its application to such data is still very much in its infancy. Although top-down modelling approaches such as PBA 42 and Waddington-OT43 provide powerful paradigms for quantifying state-manifolds, they also possess intrinsic limitations, which can only be overcome by modelling the molecular complexity within single cells. Illustrating this, modelling single-cell data from the bottom-up using molecular entropy concepts has yielded reasonably accurate single-cell proxies for developmental potential, which have proved useful for identifying root and stem-like states, especially in the context of non-temporal or cancer scRNA-Seq data where the identification of these states is particularly difficult. Although some of these proxies have displayed good resolution, it is unclear how accurate they are for detecting primed states or distinguishing quiescent from activated states in pluri-and-multipotent populations. Further validation is therefore needed. It is also clear that current potency measures are imperfect, partly due to the technical noise of single-cell RNA-Seq assays, but also due to the relative simplicity of the underlying models. Novel strategies to smooth out noise, like those used in CytoTRACE 121, are needed, and should ideally also minimize the risk of overfitting. One possibility would be to integrate bottom-up and top-down modelling, for instance by iteratively solving drift-diffusion models for the potential energy function using the single-cell potency estimates from CytoTRACE 121 or SCENT 101 as input. Such integrative approaches remain uncharted territory. The complexity of the models being used must also increase, but only as far as they obey the principle of parsimony, also known as Occam’s Razor. An obvious direction to explore would be to consider incorporating additional epigenetic information (e.g. ATAC-Seq & DNA methylation), obtained from technologies such as scM&T 158, sci-CAR 76 or snm3C-Seq 162, that allow simultaneous measurement of multiple data-types in the same cell. Indeed, recent lineage-tracing technologies that have formally linked cell-progenitor states to cell-fate, indicate that sole reliance on mRNA expression may not be sufficient to fully predict cell-fate and that additional molecular information (e.g. chromatin states) may be needed 26. Another possibility is to further refine the molecular network models, as motivated by the success of a method like SCENT 101, and where such refinements to say PPI networks are now increasingly possible thanks to protein subcellular localization efforts and more detailed and cell-type specific interactome mapping 163, 164. More fundamentally, bottom-up single-cell measures based on entropy, RNA-velocity or gene-count provide a starting point in which to explain the ‘arrow of time’ in cellular development, offering a fresh orthogonal perspective to those derived from gene regulatory dynamics 41.
Although the original Waddington landscape has now given way to a more realistic and complex state-manifold 15–17, visualization of essential features on these manifolds is important in order to build intuition, yet this remains a challenge. Current tools such as NetLand 165 or Monte-Carlo based methods 166 only offer visualization for manifolds associated with relatively low-dimensional GRNs, whilst there is an increased need for visualization of landscapes derived from large empirical scRNA-Seq datasets. A related outstanding challenge is the choice of most sensible phase space coordinates to use for analysis and visualization. Perhaps naively, current approaches treat all genes in the high-dimensional space on an equal footing, only using variability criteria to perform feature selection and subsequent dimensional reduction, yet in the context of development, differentiation and reprogramming, it is transcription factors that constitute the major players 74. Thus, current tools for estimating regulatory activity in single-cells 78 need to be improved in order to better characterize relevant phase space coordinates, and hence to improve the modelling of state-manifolds. Once again, integrative analysis of multi-modal single-cell data (e.g. DNA methylation/ATAC-Seq and gene expression) 167–169 combined with orthogonal prior information (e.g. TF-regulons or binding-motif databases), may offer the best computational strategy to derive reliable regulatory activity maps that can serve as coordinates for subsequent phase-space representations. This is important in order to extend the construction of current local state-manifolds to global manifolds, which are necessary for predicting and understanding the outcomes of cell-fate reprogramming 170 and organoid generation experiments 97, 171, and which could be realized using techniques that integrate single-cell potency measures with infinite-range spin glass models 98.
We envisage that statistical mechanical spin-glass models 172 will also play a fundamental role to help elucidate design principles underlying the spatial composition and distribution of cell-states in human organs. Such complex cellular ensembles are composed of several different cell types each distributed spatially according to a pattern dictated by intercellular communication signals and aimed at optimizing tissue-function. This is reminiscent of optimization problems that have been encountered in many other fields of science, from airline scheduling, to design principles in materials and semiconductor science, and therefore potentially amenable to analysis with the same spin-glass models that have found widespread application in these disciplines. Although not using a spin-glass per se, preliminary pioneering work in this direction used optimal transport theory to infer the spatial distribution of single-cells in complex tissues, using only scRNA-Seq data as input, thus pointing towards the existence of optimization design principles underlying spatial tissue architecture 173. Spin-glasses may further help in modeling dynamic changes in spatial cellular architecture, such as those in development and disease. A type of spin-glass model known as a Markov random-field has already been used in combination with spatial single-cell transcriptomic mapping to help integrate single-cell transcriptomes with local patterns of intercellular communication to better understand the regulatory network principles controlling cell-identity 174, 175. Experimental and computational advances in mapping intercellular communication 176–178, for instance, as recently accomplished to uncover such communication between structural and immune cells 179, will be important as a means of building more realistic spin-glass models of tissue function, as well as to dissect the relative roles of inter-and-intra cellular signaling in controlling cell-population features such as regulated stochasticity.
The ability to measure key molecular features at single-cell resolution means that the functions of single-cells can finally be understood within the context of the large spatial, dynamic and interacting cellular ensembles they form part of. Statistical Mechanics is set to help us achieve a deeper understanding of cell biological systems at multiple length scales, in the same way it has done so for materials science. We envisage an era of vibrant cross-pollination between these disciplines.
Key points:
Stochastic Markov processes provide a powerful paradigm for inferring state-manifolds from single-cell dynamics.
The need for more bottom-up modelling of single-cell data.
Molecular entropy underpins differentiation potency of single-cells.
Entropy-based estimation of single cell potency allows marker-free identification of root/stem-like states, and delineation of differentiation hierarchies.
Statistical mechanics links microstate features of single-cells (e.g. molecular pluripotency) to macrostate cell population features (e.g. functional pluripotency).
Cell-fate transitions exhibit the hallmarks of critical phase transitions.
Increased covariation is a signal to identify cell-fate transitions and their regulators, in development and disease.
Acknowledgements
AET is funded by the NSFC (grant numbers 31571359 and 31771464). APF is funded by grant DP1 DK119129 from the NIH.
GLOSSARY:
- Statistical Mechanics
A discipline of physics, which broadly speaking aims to describe macroscopic observables of a general system in terms of the properties of its microscopic constituents, including their interactions
- Macrostate
A macroscopic observable of a system. Examples include electrical conductivity of a material, or the number of animals within an ecosystem
- Microstate
The instantaneous and often dynamic state in which each microscopic constituent of the system is in, and which is often unobserved. Examples include the speed and direction at which each air molecule moves, or the electrical activity of each neuron in a brain
- Phase transition
A phase transition is an abrupt, discontinuous change in the macroscopic properties of a system, often as a result of energy exchange with the environment, and driven by changes in the microscopic interaction patterns
- High-throughput
In the context of single-cell technology, this means the ability to measure molecular properties in large numbers of cells, on the order of thousands to millions
- Waddington epigenetic landscape
A 3-dimensional representation of cellular development, with differentiation trajectories and cell-states described by bifurcating valleys and local basins, and with the elevation in the landscape describing developmental potential
- Differentiation potency hierarchy
The hierarchical arrangement of cell types, according to the number of downstream cell types a given cell could give rise to during development or in a general differentiation process
- Potential energy
A term associated with the Waddington landscape, representing the elevation and correlating with developmental potential, in analogy with the physical potential energy associated with the elevation in geophysical landscapes
- Dynamical systems theory
A branch of classical physics that describes the dynamics of multiple variables (e.g. molecular concentrations) in terms of a set of linear or non-linear differential equations
- Regulatory network motif
It refers to the topological regulatory interaction pattern involving activation and/or inhibition between transcription factors, as specified in a gene-regulatory network
- Single-cell omics
A generic term referring to a wide range of different technologies that can generate different types of molecular profiles at single-cell resolution, of which single-cell RNA-Seq and single-cell ATAC-Seq are two examples
- Functional cellular state
The state of the complex molecular network within a cell that determines its function, encoded by a multi-dimensional vector describing properties such as cell-type, cell-cycle phase and metabolic state
- State manifold
A generalization of Waddington’s landscape providing a more realistic geometric representation of functional cellular states and of the single-cell dynamics connecting these states
- Feature selection
In the context of scRNA-Seq data analysis, this refers to a filtering step whereby all cells passing quality control are used to select genes according to some statistical criterion (e.g. high variability across cells)
- Dimensional reduction
An analytical step in analysis of big data, including scRNA-Seq data, where a lower-dimensional representation of the data is sought that can capture a high proportion of the variance in the data
- Bottom-up modeling
In the context of single-cell data, this refers to an analysis paradigm where one formulates an explicit dynamic (network) model to describe the data within each cell, often without the need to use data from other cells
- Top-down modeling
In the context of single-cell data, this refers to an analysis paradigm where one analyzes the data from many cells together, to infer properties of individual cells
- Dropout rate
This refers to the generally low sensitivity to detect gene expression in scRNA-Seq assays, specially for genes expressed at a low number of molecules in a cell, resulting in potentially many zero expression values
- Quasi-potential
The name given to the scalar function obtained by solving sets of non-linear differential equations describing the dynamics of transcription factor concentrations, and which approximates developmental potential
- Entropy
A generic term to quantify the amount of uncertainty associated with a system or the outcome of some measurement
- Random walk
A stochastic Markov process on a finite discrete state space, often represented as nodes on a network/graph, and describing a trajectory along nodes, with transitions between nodes following a specific probability distribution
- Mass-action principle
A physical law which states that the probability (rate) of a molecular interaction (reaction) is proportional to the product of the concentrations of each molecule (reactant)
- Scale-free (network)
A type of network where the probability of finding a node with n neighbours decays according to a power law in n, i.e. it decays slower than an exponential function. The implication is that such networks contain network hubs
- Hubs
Nodes within a network that possess an abnormally high number of neighbours. They define outliers in the degree distribution, and are a key feature of real biological networks including protein-protein-interaction networks
- Gene-count
The number of expressed genes (i.e. number of genes with non-zero expression values) in a cell, as derived from a scRNA-Seq profile
- Lineage trajectory
A one-dimensional trajectory in a high-dimensional phase space describing the dynamics of a cell, but often depicted graphically in a low-dimensional reduced space
- Root state
In the context of inferring lineage-trajectories from scRNA-Seq data, this refers to the cell (or cluster of cells) where the trajectory starts, and which needs to be assigned before inference of trajectories can take place
- Multi-lineage priming
In a cell population, this refers to the existence of some cells each one primed or restricted to differentiate into one of many downstream lineages
- Funtional pluripotency
A term used to characterize pluripotency at the level of a cell population, and which refers to the ability of this population to give rise to cellular progeny of each of the 3 main germ layers
- Phase space
An abstract space (usually high-dimensional) in which each point corresponds to a functional cellular state, with the dynamics of a cell’s state describing a one-dimensional trajectory in this space
- Meta-stable
In the context of attractors, it refers to locally stable states, which however are not stable under higher-energy perturbations. Their stability is therefore often only transient
- Stochastic
In relation to some variable, it refers to our inability to predict with certainty the value this variable would take if observed. This randomness can be due to incomplete knowledge or be inherent/intrinsic to the system
- Stochastic process
A process describing multiple observations of a stochastic variable, often in time, or in some more abstract temporal space
- Markov process
A memory-less stochastic process where the state of the system (e.g. cell) at any given timepoint is determined only by its immediately previous state
- Markov Chain
A Markov process on a finite discrete state space (often a graph), defined by a probability matrix that describes the probabilities of transition between connecting states (in the graph context, these are the nodes)
- Pseudotime
A temporal variable computed for each cell along a lineage trajectory, measuring the differentiation time from a given root state. It correlates with experimental differentiation stage and differentation potency but is also distinct
- Cell-fate probability
The probability that a given cell will differentiate and give rise to progeny in a particular cell-fate, and which can be estimated from a Markov Chain description of single-cell dynamics
- Optimal transport
A branch of mathematics that deals with optimizing the cost of transporting a distribution of mass (e.g. cells) between two successive locations, and which is amenable to solution via numerical programming
- Least action principle
A variational principle derived from classical dynamics, where the dynamics of the system can be derived from the minimization of an energy function
- Velocity field
In the context of scRNA-Seq data, a low-dimensional static graphical representation of cell dynamics, in which the future transcriptomic state of each cell is indicated by an arrow pointing away from the cell
- TF-regulon
A regulon for a given TF consists of a set of direct (and possibly also indirect) targets of the TF and whose average gene expression provides a faithful measure of the TF’s regulatory activity
- Spin-glass
A statistical mechanical model used to describe disordered physical systems composed of many interacting particles in a high-dimensional state-space and characterised by a relatively high number of equivalent low energy states
- Order-parameter
A parameter of a statistical mechanical model, whereby varying this parameter can lead to transitions between different low-energy states
- Correlation length
A term used frequently in statistical mechanics to describe the strength of correlations between neighboring microscopic elements (e.g. atoms/molecules) in a system, and which typically decays with distance or timepoint
- Saddle-node bifurcation
A type of dynamical bifurcation associated with the emergence of an unstable “saddle-node” state in phase space, often termed a tipping point, and which has been proposed to describe the transition to a disease state
- Infinite range spin-glass
A type of spin-glass where interactions can take place over very large distances encompassing the whole system
- Ising-spin model
A special case of a spin-glass where interactions are localized to nearest neighbors and where the state-space of each particle is only 2-dimensional
- Occam’s Razor
Also called law of parsimony, is a principle stated by the philosopher William of Ockham (1285–1347) that gives precedence to simplicity: of two competing theories, the simpler explanation of an entity is to be preferred
- Global manifold
The global manifold refers to the complete state manifold encompassing all developmental stages and cell types within a given organism, to be distinguished from local state-manifolds that only refer to specific subparts
Footnotes
Competing interests
The authors declare no competing interests.
REFERENCES
- 1.Feynman RP Statistical Mechanics: A Set of Lectures. (CRC Press, 2018). [Google Scholar]
- 2.Landau DA & Lifshitz EM Statistical Physics, Vol. 5, Edn. 3rd. (Elsevier, 1980). [Google Scholar]
- 3.Scheffer M Complex systems: Foreseeing tipping points. Nature 467, 411–412 (2010). [DOI] [PubMed] [Google Scholar]
- 4.Scheffer M, Carpenter S, Foley JA, Folke C & Walker B Catastrophic shifts in ecosystems. Nature 413, 591–596 (2001). [DOI] [PubMed] [Google Scholar]
- 5.Bryngelson JD & Wolynes PG Spin glasses and the statistical mechanics of protein folding. Proceedings of the National Academy of Sciences of the United States of America 84, 7524–7528 (1987). [DOI] [PMC free article] [PubMed] [Google Scholar]
- 6.Goldstein RA, Luthey-Schulten ZA & Wolynes PG Optimal protein-folding codes from spin-glass theory. Proceedings of the National Academy of Sciences of the United States of America 89, 4918–4922 (1992). [DOI] [PMC free article] [PubMed] [Google Scholar]
- 7.Tang F et al. mRNA-Seq whole-transcriptome analysis of a single cell. Nature methods 6, 377–382 (2009). [DOI] [PubMed] [Google Scholar]
- 8.Tang F, Lao K & Surani MA Development and applications of single-cell transcriptome analysis. Nature methods 8, S6–11 (2011). [DOI] [PMC free article] [PubMed] [Google Scholar]
- 9.Rozenblatt-Rosen O, Stubbington MJT, Regev A & Teichmann SA The Human Cell Atlas: from vision to reality. Nature 550, 451–453 (2017). [DOI] [PubMed] [Google Scholar]
- 10.Regev A et al. The Human Cell Atlas. eLife 6 (2017). [DOI] [PMC free article] [PubMed] [Google Scholar]
- 11.MacArthur BD & Lemischka IR Statistical mechanics of pluripotency. Cell 154, 484–489 (2013). [DOI] [PubMed] [Google Scholar]
- 12.Efroni S, Melcer S, Nissim-Rafinia M & Meshorer E Stem cells do play with dice: a statistical physics view of transcription. Cell Cycle 8, 43–48 (2009). [DOI] [PubMed] [Google Scholar]
- 13.Waddington CR Principles of Development and Differentiation. (Macmillan Company, New York; 1966). [Google Scholar]
- 14.Waddington CH The Strategy of the Genes. A Discussion of Some Aspects of Theoretical Biology. (Allen and Unwin, London; 1957). [Google Scholar]
- 15.Laurenti E & Gottgens B From haematopoietic stem cells to complex differentiation landscapes. Nature 553, 418–426 (2018). [DOI] [PMC free article] [PubMed] [Google Scholar]
- 16.Wagner DE & Klein AM Lineage tracing meets single-cell omics: opportunities and challenges. Nature reviews. Genetics (2020). [DOI] [PMC free article] [PubMed] [Google Scholar]
- 17.Ladewig J, Koch P & Brustle O Leveling Waddington: the emergence of direct programming and the loss of cell fate hierarchies. Nature reviews. Molecular cell biology 14, 225–236 (2013). [DOI] [PubMed] [Google Scholar]
- 18.Ferrell JE Jr. Bistability, bifurcations, and Waddington’s epigenetic landscape. Current biology: CB 22, R458–466 (2012). [DOI] [PMC free article] [PubMed] [Google Scholar]
- 19.Huang S, Guo YP, May G & Enver T Bifurcation dynamics in lineage-commitment in bipotent progenitor cells. Developmental biology 305, 695–713 (2007). [DOI] [PubMed] [Google Scholar]
- 20.Moris N, Pina C & Arias AM Transition states and cell fate decisions in epigenetic landscapes. Nature reviews. Genetics 17, 693–703 (2016). [DOI] [PubMed] [Google Scholar]
- 21.Delbrueck M in Unite’ s Biologiques Doue’ es de Continuite’ Genetique (International Symposium CNRS No. 8). 33–34 (Paris; 1949). [Google Scholar]
- 22.Huang S The molecular and mathematical basis of Waddington’s epigenetic landscape: a framework for post-Darwinian biology? BioEssays : news and reviews in molecular, cellular and developmental biology 34, 149–157 (2012). [DOI] [PubMed] [Google Scholar]
- 23.Bessonnard S et al. Gata6, Nanog and Erk signaling control cell fate in the inner cell mass through a tristable regulatory network. Development 141, 3637–3648 (2014). [DOI] [PubMed] [Google Scholar]
- 24.Messerschmidt DM & Kemler R Nanog is required for primitive endoderm formation through a non-cell autonomous mechanism. Developmental biology 344, 129–137 (2010). [DOI] [PubMed] [Google Scholar]
- 25.Fujikura J et al. Differentiation of embryonic stem cells is induced by GATA factors. Genes & development 16, 784–789 (2002). [DOI] [PMC free article] [PubMed] [Google Scholar]
- 26.Weinreb C, Rodriguez-Fraticelli A, Camargo FD & Klein AM Lineage tracing on transcriptional landscapes links state to fate during differentiation. Science 367 (2020). [DOI] [PMC free article] [PubMed] [Google Scholar]
- 27.Brennecke P et al. Accounting for technical noise in single-cell RNA-seq experiments. Nature methods 10, 1093–1095 (2013). [DOI] [PubMed] [Google Scholar]
- 28.Paulsson J Summing up the noise in gene networks. Nature 427, 415–418 (2004). [DOI] [PubMed] [Google Scholar]
- 29.Munsky B, Neuert G & van Oudenaarden A Using gene expression noise to understand gene regulation. Science 336, 183–187 (2012). [DOI] [PMC free article] [PubMed] [Google Scholar]
- 30.Stegle O, Teichmann SA & Marioni JC Computational and analytical challenges in single-cell transcriptomics. Nature reviews. Genetics 16, 133–145 (2015). [DOI] [PubMed] [Google Scholar]
- 31.Eling N, Morgan MD & Marioni JC Challenges in measuring and understanding biological noise. Nature reviews. Genetics 20, 536–548 (2019). [DOI] [PMC free article] [PubMed] [Google Scholar]
- 32.Zhou JX, Aliyu MD, Aurell E & Huang S Quasi-potential landscape in complex multi-stable systems. Journal of the Royal Society, Interface / the Royal Society 9, 3539–3553 (2012). [DOI] [PMC free article] [PubMed] [Google Scholar]
- 33.Wang J, Zhang K, Xu L & Wang E Quantifying the Waddington landscape and biological paths for development and differentiation. Proceedings of the National Academy of Sciences of the United States of America 108, 8257–8262 (2011). [DOI] [PMC free article] [PubMed] [Google Scholar]
- 34.Lv C, Li X, Li F & Li T Constructing the energy landscape for genetic switching system driven by intrinsic noise. PloS one 9, e88167 (2014). [DOI] [PMC free article] [PubMed] [Google Scholar]
- 35.Guo J & Zheng J HopLand: single-cell pseudotime recovery using continuous Hopfield network-based modeling of Waddington’s epigenetic landscape. Bioinformatics 33, i102–i109 (2017). [DOI] [PMC free article] [PubMed] [Google Scholar]
- 36.Fard AT, Srihari S, Mar JC & Ragan MA Not just a colourful metaphor: modelling the landscape of cellular development using Hopfield networks. NPJ Syst Biol Appl 2, 16001 (2016). [DOI] [PMC free article] [PubMed] [Google Scholar]
- 37.Li C & Wang J Quantifying cell fate decisions for differentiation and reprogramming of a human stem cell network: landscape and biological paths. PLoS computational biology 9, e1003165 (2013). [DOI] [PMC free article] [PubMed] [Google Scholar]
- 38.Velten L et al. Human haematopoietic stem cell lineage commitment is a continuous process. Nature cell biology 19, 271–281 (2017). [DOI] [PMC free article] [PubMed] [Google Scholar]
- 39.Bonzanni N et al. Hard-wired heterogeneity in blood stem cells revealed using a dynamic regulatory network model. Bioinformatics 29, i80–88 (2013). [DOI] [PMC free article] [PubMed] [Google Scholar]
- 40.Krumsiek J, Marr C, Schroeder T & Theis FJ Hierarchical differentiation of myeloid progenitors is encoded in the transcription factor network. PloS one 6, e22649 (2011). [DOI] [PMC free article] [PubMed] [Google Scholar]
- 41.Wang J, Xu L, Wang E & Huang S The potential landscape of genetic circuits imposes the arrow of time in stem cell differentiation. Biophysical journal 99, 29–39 (2010). [DOI] [PMC free article] [PubMed] [Google Scholar]
- 42.Weinreb C, Wolock S, Tusi BK, Socolovsky M & Klein AM Fundamental limits on dynamic inference from single-cell snapshots. Proceedings of the National Academy of Sciences of the United States of America 115, E2467–E2476 (2018). [DOI] [PMC free article] [PubMed] [Google Scholar]
- 43.Schiebinger G et al. Optimal-Transport Analysis of Single-Cell Gene Expression Identifies Developmental Trajectories in Reprogramming. Cell 176, 1517 (2019). [DOI] [PMC free article] [PubMed] [Google Scholar]
- 44.Kaern M, Elston TC, Blake WJ & Collins JJ Stochasticity in gene expression: from theories to phenotypes. Nature reviews. Genetics 6, 451–464 (2005). [DOI] [PubMed] [Google Scholar]
- 45.Stumpf PS et al. Stem Cell Differentiation as a Non-Markov Stochastic Process. CellSyst 5, 268–282 e267 (2017). [DOI] [PMC free article] [PubMed] [Google Scholar]
- 46.Tusi BK et al. Population snapshots predict early haematopoietic and erythroid hierarchies. Nature 555, 54–60 (2018). [DOI] [PMC free article] [PubMed] [Google Scholar]
- 47.Trapnell C et al. The dynamics and regulators of cell fate decisions are revealed by pseudotemporal ordering of single cells. Nature biotechnology 32, 381–386 (2014). [DOI] [PMC free article] [PubMed] [Google Scholar]
- 48.Herman JS, Sagar & Grun D FateID infers cell fate bias in multipotent progenitors from single-cell RNA-seq data. Nature methods 15, 379–386 (2018). [DOI] [PubMed] [Google Scholar]
- 49.Saelens W, Cannoodt R, Todorov H & Saeys Y A comparison of single-cell trajectory inference methods. Nature biotechnology 37, 547–554 (2019). [DOI] [PubMed] [Google Scholar]
- 50.Cao J et al. The single-cell transcriptional landscape of mammalian organogenesis. Nature 566, 496–502 (2019). [DOI] [PMC free article] [PubMed] [Google Scholar]
- 51.Qiu X et al. Reversed graph embedding resolves complex single-cell trajectories. Nature methods 14, 979–982 (2017). [DOI] [PMC free article] [PubMed] [Google Scholar]
- 52.Haghverdi L, Buttner M, Wolf FA, Buettner F & Theis FJ Diffusion pseudotime robustly reconstructs lineage branching. Nature methods 13, 845–848 (2016). [DOI] [PubMed] [Google Scholar]
- 53.Coifman RR et al. Geometric diffusions as a tool for harmonic analysis and structure definition of data: diffusion maps. Proceedings of the National Academy of Sciences of the United States of America 102, 7426–7431 (2005). [DOI] [PMC free article] [PubMed] [Google Scholar]
- 54.Setty M et al. Characterization of cell fate probabilities in single-cell data with Palantir. Nature biotechnology 37, 451–460 (2019). [DOI] [PMC free article] [PubMed] [Google Scholar]
- 55.Villani C Optimal transport, old and new. (Springer, 2008). [Google Scholar]
- 56.Yanez A et al. Granulocyte-Monocyte Progenitors and Monocyte-Dendritic Cell Progenitors Independently Produce Functionally Distinct Monocytes. Immunity 47, 890–902 e894 (2017). [DOI] [PMC free article] [PubMed] [Google Scholar]
- 57.Alemany A, Florescu M, Baron CS, Peterson-Maduro J & van Oudenaarden A Whole-organism clone tracing using single-cell sequencing. Nature 556, 108–112 (2018). [DOI] [PubMed] [Google Scholar]
- 58.Chan MM et al. Molecular recording of mammalian embryogenesis. Nature 570, 77–82 (2019). [DOI] [PMC free article] [PubMed] [Google Scholar]
- 59.Fischer DS et al. Inferring population dynamics from single-cell RNA-sequencing time series data. Nature biotechnology 37, 461–468 (2019). [DOI] [PMC free article] [PubMed] [Google Scholar]
- 60.Trapnell C Defining cell types and states with single-cell genomics. Genome research 25, 1491–1498 (2015). [DOI] [PMC free article] [PubMed] [Google Scholar]
- 61.Miao Z et al. Putative cell type discovery from single-cell gene expression data. Nature methods 17, 621–628 (2020). [DOI] [PubMed] [Google Scholar]
- 62.Pliner HA, Shendure J & Trapnell C Supervised classification enables rapid annotation of cell atlases. Nature methods 16, 983–986 (2019). [DOI] [PMC free article] [PubMed] [Google Scholar]
- 63.Schiller HB et al. The Human Lung Cell Atlas: A High-Resolution Reference Map of the Human Lung in Health and Disease. American journal of respiratory cell and molecular biology 61, 31–41 (2019). [DOI] [PMC free article] [PubMed] [Google Scholar]
- 64.Becht E et al. Dimensionality reduction for visualizing single-cell data using UMAP. Nature biotechnology (2018). [DOI] [PubMed] [Google Scholar]
- 65.Butler A, Hoffman P, Smibert P, Papalexi E & Satija R Integrating single-cell transcriptomic data across different conditions, technologies, and species. Nature biotechnology 36, 411–420 (2018). [DOI] [PMC free article] [PubMed] [Google Scholar]
- 66.Moon KR et al. Visualizing structure and transitions in high-dimensional biological data. Nature biotechnology 37, 1482–1492 (2019). [DOI] [PMC free article] [PubMed] [Google Scholar]
- 67.Newman ME Modularity and community structure in networks. Proceedings of the National Academy of Sciences of the United States of America 103, 8577–8582 (2006). [DOI] [PMC free article] [PubMed] [Google Scholar]
- 68.Clauset A, Newman ME & Moore C Finding community structure in very large networks. Physical review. E, Statistical, nonlinear, and soft matter physics 70, 066111 (2004). [DOI] [PubMed] [Google Scholar]
- 69.Newman ME Finding community structure in networks using the eigenvectors of matrices. Physical review. E, Statistical, nonlinear, and soft matter physics 74, 036104 (2006). [DOI] [PubMed] [Google Scholar]
- 70.Blondel VD, Guillaume JL, Lambiotte R & Lefebvre E Fast unfolding of communities in large networks. J Stat Mech: Theory and Experiment 10, P10008 (2008). [Google Scholar]
- 71.Reichardt J & Bornholdt S Statistical mechanics of community detection. Physical review. E, Statistical, nonlinear, and soft matter physics 74, 016110 (2006). [DOI] [PubMed] [Google Scholar]
- 72.Kobak D & Berens P The art of using t-SNE for single-cell transcriptomics. Nature communications 10, 5416 (2019). [DOI] [PMC free article] [PubMed] [Google Scholar]
- 73.Heinaniemi M et al. Gene-pair expression signatures reveal lineage control. Nature methods 10, 577–583 (2013). [DOI] [PMC free article] [PubMed] [Google Scholar]
- 74.Graf T & Enver T Forcing cells to change lineages. Nature 462, 587–594 (2009). [DOI] [PubMed] [Google Scholar]
- 75.Yamanaka S & Blau HM Nuclear reprogramming to a pluripotent state by three approaches. Nature 465, 704–712 (2010). [DOI] [PMC free article] [PubMed] [Google Scholar]
- 76.Cao J et al. Joint profiling of chromatin accessibility and gene expression in thousands of single cells. Science 361, 1380–1385 (2018). [DOI] [PMC free article] [PubMed] [Google Scholar]
- 77.Moignard V et al. Decoding the regulatory network of early blood development from single-cell gene expression measurements. Nature biotechnology 33, 269–276 (2015). [DOI] [PMC free article] [PubMed] [Google Scholar]
- 78.Aibar S et al. SCENIC: single-cell regulatory network inference and clustering. Nature methods 14, 1083–1086 (2017). [DOI] [PMC free article] [PubMed] [Google Scholar]
- 79.Huynh-Thu VA, Irrthum A, Wehenkel L & Geurts P Inferring regulatory networks from expression data using tree-based methods. PloS one 5 (2010). [DOI] [PMC free article] [PubMed] [Google Scholar]
- 80.Schafer J & Strimmer K An empirical Bayes approach to inferring large-scale gene association networks. Bioinformatics 21, 754–764 (2005). [DOI] [PubMed] [Google Scholar]
- 81.Opgen-Rhein R & Strimmer K From correlation to causation networks: a simple approximate learning algorithm and its application to high-dimensional plant gene expression data. BMC systems biology 1, 37 (2007). [DOI] [PMC free article] [PubMed] [Google Scholar]
- 82.Margolin AA et al. ARACNE: an algorithm for the reconstruction of gene regulatory networks in a mammalian cellular context. BMC bioinformatics 7 Suppl 1, S7 (2006). [DOI] [PMC free article] [PubMed] [Google Scholar]
- 83.Grun D Revealing dynamics of gene expression variability in cell state space. Nature methods 17, 45–49 (2020). [DOI] [PMC free article] [PubMed] [Google Scholar]
- 84.Chen S & Mar JC Evaluating methods of inferring gene regulatory networks highlights their lack of performance for single cell gene expression data. BMC bioinformatics 19, 232 (2018). [DOI] [PMC free article] [PubMed] [Google Scholar]
- 85.Oki S et al. ChIP-Atlas: a data-mining suite powered by full integration of public ChIP-seq data. EMBO reports 19 (2018). [DOI] [PMC free article] [PubMed] [Google Scholar]
- 86.Consortium GT The Genotype-Tissue Expression (GTEx) project. Nature genetics 45, 580–585 (2013). [DOI] [PMC free article] [PubMed] [Google Scholar]
- 87.Kulakovskiy IV et al. HOCOMOCO: towards a complete collection of transcription factor binding models for human and mouse via large-scale ChIP-Seq analysis. Nucleic acids research 46, D252–D259 (2018). [DOI] [PMC free article] [PubMed] [Google Scholar]
- 88.Kulakovskiy IV et al. HOCOMOCO: expansion and enhancement of the collection of transcription factor binding sites models. Nucleic acids research 44, D116–125 (2016). [DOI] [PMC free article] [PubMed] [Google Scholar]
- 89.Holland CH et al. Robustness and applicability of transcription factor and pathway analysis tools on single-cell RNA-seq data. Genome biology 21, 36 (2020). [DOI] [PMC free article] [PubMed] [Google Scholar]
- 90.Wang N & Teschendorff AE Leveraging high-powered RNA-Seq datasets to improve inference of regulatory activity in single-cell RNA-Seq data. bioRxiv (2019). [Google Scholar]
- 91.Bargaje R et al. Cell population structure prior to bifurcation predicts efficiency of directed differentiation in human induced pluripotent cells. Proceedings of the National Academy of Sciences of the United States of America 114, 2271–2276 (2017). [DOI] [PMC free article] [PubMed] [Google Scholar]
- 92.Mojtahedi M et al. Cell Fate Decision as High-Dimensional Critical State Transition. PLoS biology 14, e2000640 (2016). [DOI] [PMC free article] [PubMed] [Google Scholar]
- 93.Richard A et al. Single-Cell-Based Analysis Highlights a Surge in Cell-to-Cell Molecular Variability Preceding Irreversible Commitment in a Differentiation Process. PLoS biology 14, e1002585 (2016). [DOI] [PMC free article] [PubMed] [Google Scholar]
- 94.Stuart T & Satija R Integrative single-cell analysis. Nature reviews. Genetics 20, 257–272 (2019). [DOI] [PubMed] [Google Scholar]
- 95.Amit DJ, Gutfreund H & Sompolinsky H Spin-glass models of neural networks. Physical Review A 32, 1007–1017 (1985). [DOI] [PubMed] [Google Scholar]
- 96.Kirkpatrick S & Sherrington D Infinite-ranged models of spin-glasses. Phys Rev B CondensMatter 17, 4384–4403 (1978). [Google Scholar]
- 97.Wu H et al. Comparative Analysis and Refinement of Human PSC-Derived Kidney Organoid Differentiation with Single-Cell Transcriptomics. Cell stem cell 23, 869–881 e868 (2018). [DOI] [PMC free article] [PubMed] [Google Scholar]
- 98.Lang AH, Li H, Collins JJ & Mehta P Epigenetic landscapes explain partially reprogrammed cells and identify key reprogramming genes. PLoS computational biology 10, e1003734 (2014). [DOI] [PMC free article] [PubMed] [Google Scholar]
- 99.Teschendorff AE Avoiding common pitfalls in machine learning omic data science. Nat Mater 18, 422–427 (2019). [DOI] [PubMed] [Google Scholar]
- 100.Banerji CR et al. Cellular network entropy as the energy potential in Waddington’s differentiation landscape. Scientific reports 3, 3039 (2013). [DOI] [PMC free article] [PubMed] [Google Scholar]
- 101.Teschendorff AE & Enver T Single-cell entropy for accurate estimation of differentiation potency from a cell’s transcriptome. Nature communications 8, 15599 (2017). [DOI] [PMC free article] [PubMed] [Google Scholar]
- 102.Guo M, Bao EL, Wagner M, Whitsett JA & Xu Y SLICE: determining cell differentiation and lineage based on single cell entropy. Nucleic acids research (2016). [DOI] [PMC free article] [PubMed] [Google Scholar]
- 103.Grun D et al. De Novo Prediction of Stem Cell Identity using Single-Cell Transcriptome Data. Cell stem cell 19, 266–277 (2016). [DOI] [PMC free article] [PubMed] [Google Scholar]
- 104.van Wieringen WN & van der Vaart AW Statistical analysis of the cancer cell’s molecular entropy using high-throughput data. Bioinformatics 27, 556–563 (2011). [DOI] [PubMed] [Google Scholar]
- 105.West J, Bianconi G, Severini S & Teschendorff AE Differential network entropy reveals cancer system hallmarks. Scientific reports 2, 802 (2012). [DOI] [PMC free article] [PubMed] [Google Scholar]
- 106.Teschendorff AE & Severini S Increased entropy of signal transduction in the cancer metastasis phenotype. BMC systems biology 4, 104 (2010). [DOI] [PMC free article] [PubMed] [Google Scholar]
- 107.Jenkinson G, Pujadas E, Goutsias J & Feinberg AP Potential energy landscapes identify the information-theoretic nature of the epigenome. Nature genetics (2017). [DOI] [PMC free article] [PubMed] [Google Scholar]
- 108.Hannum G et al. Genome-wide methylation profiles reveal quantitative views of human aging rates. Molecular cell 49, 359–367 (2013). [DOI] [PMC free article] [PubMed] [Google Scholar]
- 109.Landau DA et al. Locally disordered methylation forms the basis of intratumor methylome variation in chronic lymphocytic leukemia. Cancer cell 26, 813–825 (2014). [DOI] [PMC free article] [PubMed] [Google Scholar]
- 110.Zipori D The nature of stem cells: state rather than entity. Nature reviews. Genetics 5, 873–878 (2004). [DOI] [PubMed] [Google Scholar]
- 111.Lee TI et al. Control of developmental regulators by Polycomb in human embryonic stem cells. Cell 125, 301–313 (2006). [DOI] [PMC free article] [PubMed] [Google Scholar]
- 112.Efroni S et al. Global transcription in pluripotent embryonic stem cells. Cell stem cell 2, 437–447 (2008). [DOI] [PMC free article] [PubMed] [Google Scholar]
- 113.Gaspar-Maia A, Alajem A, Meshorer E & Ramalho-Santos M Open chromatin in pluripotency and reprogramming. Nature reviews. Molecular cell biology 12, 36–47 (2011). [DOI] [PMC free article] [PubMed] [Google Scholar]
- 114.Meshorer E & Misteli T Chromatin in pluripotent embryonic stem cells and differentiation. Nature reviews. Molecular cell biology 7, 540–546 (2006). [DOI] [PubMed] [Google Scholar]
- 115.Flouriot G et al. The Basal Level of Gene Expression Associated with Chromatin Loosening Shapes Waddington Landscapes and Controls Cell Differentiation. Journal of molecular biology (2020). [DOI] [PubMed] [Google Scholar]
- 116.Cerami EG et al. Pathway Commons, a web resource for biological pathway data. Nucleic acids research 39, D685–690 (2011). [DOI] [PMC free article] [PubMed] [Google Scholar]
- 117.Rodchenkov I et al. Pathway Commons 2019 Update: integration, analysis and exploration of pathway data. Nucleic acids research 48, D489–D497 (2020). [DOI] [PMC free article] [PubMed] [Google Scholar]
- 118.Teschendorff AE, Banerji CR, Severini S, Kuehn R & Sollich P Increased signaling entropy in cancer requires the scale-free property of protein interaction networks. Scientific reports 5, 9646 (2015). [DOI] [PMC free article] [PubMed] [Google Scholar]
- 119.Barabasi AL & Albert R Emergence of scaling in random networks. Science 286, 509–512 (1999). [DOI] [PubMed] [Google Scholar]
- 120.Barabasi AL Scale-free networks: a decade and beyond. Science 325, 412–413 (2009). [DOI] [PubMed] [Google Scholar]
- 121.Gulati GS et al. Single-cell transcriptional diversity is a hallmark of developmental potential. Science 367, 405–411 (2020). [DOI] [PMC free article] [PubMed] [Google Scholar]
- 122.Shi J, Teschendorff AE, Chen W, Chen L & Li T Quantifying Waddington’s epigenetic landscape: a comparison of single-cell potency measures. Briefings in bioinformatics (2018). [DOI] [PubMed] [Google Scholar]
- 123.Athanasiadis EI et al. Single-cell RNA-sequencing uncovers transcriptional states and fate decisions in haematopoiesis. Nature communications 8, 2045 (2017). [DOI] [PMC free article] [PubMed] [Google Scholar]
- 124.Macaulay IC et al. Single-Cell RNA-Sequencing Reveals a Continuous Spectrum of Differentiation in Hematopoietic Cells. Cell reports 14, 966–977 (2016). [DOI] [PMC free article] [PubMed] [Google Scholar]
- 125.Flint J & Ideker T The great hairball gambit. PLoS genetics 15, e1008519 (2019). [DOI] [PMC free article] [PubMed] [Google Scholar]
- 126.Pina C et al. Inferring rules of lineage commitment in haematopoiesis. Nature cell biology 14, 287–294 (2012). [DOI] [PubMed] [Google Scholar]
- 127.Jin S, MacLean AL, Peng T & Nie Q scEpath: energy landscape-based inference of transition probabilities and cellular trajectories from single-cell transcriptomic data. Bioinformatics 34, 2077–2086 (2018). [DOI] [PMC free article] [PubMed] [Google Scholar]
- 128.Basso K et al. Reverse engineering of regulatory networks in human B cells. Nature genetics 37, 382–390 (2005). [DOI] [PubMed] [Google Scholar]
- 129.Ayyaz A et al. Single-cell transcriptomes of the regenerating intestine reveal a revival stem cell. Nature 569, 121–125 (2019). [DOI] [PubMed] [Google Scholar]
- 130.Nguyen QH et al. Profiling human breast epithelial cells using single cell RNA sequencing identifies cell diversity. Nature communications 9, 2028 (2018). [DOI] [PMC free article] [PubMed] [Google Scholar]
- 131.Haber AL et al. A single-cell survey of the small intestinal epithelium. Nature 551, 333–339 (2017). [DOI] [PMC free article] [PubMed] [Google Scholar]
- 132.Aizarani N et al. A human liver cell atlas reveals heterogeneity and epithelial progenitors. Nature 572, 199–204 (2019). [DOI] [PMC free article] [PubMed] [Google Scholar]
- 133.Tabar V & Studer L Pluripotent stem cells in regenerative medicine: challenges and recent progress. Nature reviews. Genetics 15, 82–92 (2014). [DOI] [PMC free article] [PubMed] [Google Scholar]
- 134.Sato T et al. Single Lgr5 stem cells build crypt-villus structures in vitro without a mesenchymal niche. Nature 459, 262–265 (2009). [DOI] [PubMed] [Google Scholar]
- 135.Treutlein B et al. Reconstructing lineage hierarchies of the distal lung epithelium using single-cell RNA-seq. Nature 509, 371–375 (2014). [DOI] [PMC free article] [PubMed] [Google Scholar]
- 136.Tabula Muris C et al. Single-cell transcriptomics of 20 mouse organs creates a Tabula Muris. Nature 562, 367–372 (2018). [DOI] [PMC free article] [PubMed] [Google Scholar]
- 137.Kharchenko PV, Silberstein L & Scadden DT Bayesian approach to single-cell differential expression analysis. Nature methods 11, 740–742 (2014). [DOI] [PMC free article] [PubMed] [Google Scholar]
- 138.Chen W et al. Single-cell landscape in mammary epithelium reveals bipotent-like cells associated with breast cancer risk and outcome. Commun Biol 2, 306 (2019). [DOI] [PMC free article] [PubMed] [Google Scholar]
- 139.Angerer P et al. destiny: diffusion maps for large-scale single-cell data in R. Bioinformatics 32, 1241–1243 (2016). [DOI] [PubMed] [Google Scholar]
- 140.Halbritter F et al. Epigenomics and Single-Cell Sequencing Define a Developmental Hierarchy in Langerhans Cell Histiocytosis. Cancer discovery 9, 1406–1421 (2019). [DOI] [PMC free article] [PubMed] [Google Scholar]
- 141.Guo W et al. Single-cell transcriptomics identifies a distinct luminal progenitor cell type in distal prostate invagination tips. Nature genetics 52, 908–918 (2020). [DOI] [PMC free article] [PubMed] [Google Scholar]
- 142.Domingues AF et al. Loss of Kat2a enhances transcriptional noise and depletes acute myeloid leukemia stem-like cells. eLife 9 (2020). [DOI] [PMC free article] [PubMed] [Google Scholar]
- 143.Chambers I et al. Nanog safeguards pluripotency and mediates germline development. Nature 450, 1230–1234 (2007). [DOI] [PubMed] [Google Scholar]
- 144.Chang HH, Hemberg M, Barahona M, Ingber DE & Huang S Transcriptome-wide noise controls lineage choice in mammalian progenitor cells. Nature 453, 544–547 (2008). [DOI] [PMC free article] [PubMed] [Google Scholar]
- 145.Hayashi K, de Sousa Lopes SMC, Tang F, Lao K & Surani MA Dynamic equilibrium and heterogeneity of mouse pluripotent stem cells with distinct functional and epigenetic states. Cell stem cell 3, 391–401 (2008). [DOI] [PMC free article] [PubMed] [Google Scholar]
- 146.La Manno G et al. RNA velocity of single cells. Nature 560, 494–498 (2018). [DOI] [PMC free article] [PubMed] [Google Scholar]
- 147.Bergen V, Lange M, Peidli S, Wolf FA & Theis FJ Generalizing RNA velocity to transient cell states through dynamical modeling. Nature biotechnology (2020). [DOI] [PubMed] [Google Scholar]
- 148.Wang L et al. The Phenotypes of Proliferating Glioblastoma Cells Reside on a Single Axis of Variation. Cancer discovery 9, 1708–1719 (2019). [DOI] [PMC free article] [PubMed] [Google Scholar]
- 149.Bose I & Pal M Criticality in cell differentiation. JBiosci 42, 683–693 (2017). [DOI] [PubMed] [Google Scholar]
- 150.Stanley HE Introduction to phase transitions and critical phenomena. (Oxford University Press, 1971). [Google Scholar]
- 151.Bandyopadhyay S et al. Rewiring of genetic networks in response to DNA damage. Science 330, 1385–1389 (2010). [DOI] [PMC free article] [PubMed] [Google Scholar]
- 152.Califano A Rewiring makes the difference. Molecular systems biology 7, 463 (2011). [DOI] [PMC free article] [PubMed] [Google Scholar]
- 153.Wang R et al. Flickering gives early warning signals of a critical transition to a eutrophic lake state. Nature 492, 419–422 (2012). [DOI] [PubMed] [Google Scholar]
- 154.Scheffer M et al. Early-warning signals for critical transitions. Nature 461, 53–59 (2009). [DOI] [PubMed] [Google Scholar]
- 155.Chen L, Liu R, Liu ZP, Li M & Aihara K Detecting early-warning signals for sudden deterioration of complex diseases by dynamical network biomarkers. Scientific reports 2, 342 (2012). [DOI] [PMC free article] [PubMed] [Google Scholar]
- 156.Gao NP, Gandrillon O, Paldi A, Herbach U & Gunawan R (2020). [DOI] [PMC free article] [PubMed] [Google Scholar]
- 157.Rulands S et al. Genome-Scale Oscillations in DNA Methylation during Exit from Pluripotency. Cell Syst 7, 63–76 e12 (2018). [DOI] [PMC free article] [PubMed] [Google Scholar]
- 158.Angermueller C et al. Parallel single-cell sequencing links transcriptional and epigenetic heterogeneity. Nature methods 13, 229–232 (2016). [DOI] [PMC free article] [PubMed] [Google Scholar]
- 159.Teschendorff AE et al. The dynamics of DNA methylation covariation patterns in carcinogenesis. PLoS computational biology 10, e1003709 (2014). [DOI] [PMC free article] [PubMed] [Google Scholar]
- 160.Sottoriva A et al. A Big Bang model of human colorectal tumor growth. Nature genetics 47, 209–216 (2015). [DOI] [PMC free article] [PubMed] [Google Scholar]
- 161.Pujadas E & Feinberg AP Regulated noise in the epigenetic landscape of development and disease. Cell 148, 1123–1131 (2012). [DOI] [PMC free article] [PubMed] [Google Scholar]
- 162.Lee DS et al. Simultaneous profiling of 3D genome structure and DNA methylation in single human cells. Nature methods 16, 999–1006 (2019). [DOI] [PMC free article] [PubMed] [Google Scholar]
- 163.Thul PJ et al. A subcellular map of the human proteome. Science 356 (2017). [DOI] [PubMed] [Google Scholar]
- 164.Luck K et al. A reference map of the human binary protein interactome. Nature 580, 402–408 (2020). [DOI] [PMC free article] [PubMed] [Google Scholar]
- 165.Guo J, Lin F, Zhang X, Tanavde V & Zheng J NetLand: quantitative modeling and visualization of Waddington’s epigenetic landscape using probabilistic potential. Bioinformatics 33, 1583–1585 (2017). [DOI] [PMC free article] [PubMed] [Google Scholar]
- 166.Zhang X, Chong KH & Zheng J (bioRxiv; 2018). [Google Scholar]
- 167.Efremova M & Teichmann SA Computational methods for single-cell omics across modalities. Nature methods 17, 14–17 (2020). [DOI] [PubMed] [Google Scholar]
- 168.Macaulay IC, Ponting CP & Voet T Single-Cell Multiomics: Multiple Measurements from Single Cells. Trends in genetics : TIG 33, 155–168 (2017). [DOI] [PMC free article] [PubMed] [Google Scholar]
- 169.Lake BB et al. Integrative single-cell analysis of transcriptional and epigenetic states in the human adult brain. Nature biotechnology 36, 70–80 (2018). [DOI] [PMC free article] [PubMed] [Google Scholar]
- 170.Cherry AB & Daley GQ Reprogramming cellular identity for regenerative medicine. Cell 148, 1110–1122 (2012). [DOI] [PMC free article] [PubMed] [Google Scholar]
- 171.Huch M, Knoblich JA, Lutolf MP & Martinez-Arias A The hope and the hype of organoid research. Development 144, 938–941 (2017). [DOI] [PubMed] [Google Scholar]
- 172.Stein DL & Newman CM Spin Glasses and Complexity. (Princeton University Press, 2013). [Google Scholar]
- 173.Nitzan M, Karaiskos N, Friedman N & Rajewsky N Gene expression cartography. Nature 576, 132–137 (2019). [DOI] [PubMed] [Google Scholar]
- 174.Eng CL et al. Transcriptome-scale super-resolved imaging in tissues by RNA seqFISH. Nature 568, 235–239 (2019). [DOI] [PMC free article] [PubMed] [Google Scholar]
- 175.Zhu Q, Shah S, Dries R, Cai L & Yuan GC Identification of spatially associated subpopulations by combining scRNAseq and sequential fluorescence in situ hybridization data. Nature biotechnology (2018). [DOI] [PMC free article] [PubMed] [Google Scholar]
- 176.Giladi A et al. Dissecting cellular crosstalk by sequencing physically interacting cells. Nature biotechnology (2020). [DOI] [PubMed] [Google Scholar]
- 177.Boisset JC et al. Mapping the physical network of cellular interactions. Nature methods 15, 547–553 (2018). [DOI] [PubMed] [Google Scholar]
- 178.Browaeys R, Saelens W & Saeys Y NicheNet: modeling intercellular communication by linking ligands to target genes. Nature methods 17, 159–162 (2020). [DOI] [PubMed] [Google Scholar]
- 179.Krausgruber T et al. Structural cells are key regulators of organ-specific immune responses. Nature 583, 296–302 (2020). [DOI] [PMC free article] [PubMed] [Google Scholar]
- 180.Gardiner CW Handbook of Stochastic Methods, Edn. 2nd. (Springer, Heidelberg; 1985). [Google Scholar]
- 181.Shi J, Li T, Chen L & Aihara K Quantifying pluripotency landscape of cell differentiation from scRNA-seq data by continuous birth-death process. PLoS computational biology 15, e1007488 (2019). [DOI] [PMC free article] [PubMed] [Google Scholar]
- 182.Ting D, Huang L & Jordan M (arXiv:1101.5435v1; 2011). [Google Scholar]
- 183.Boltzmann L Lectures on Gas Theory. (University of California, Berkeley; 1964). [Google Scholar]
- 184.Shannon CE & Weaver W The Mathematical Theory of Communication. (University of Illinois Press, Urbana; 1949). [Google Scholar]
- 185.Chen W & Teschendorff AE Estimating Differentiation Potency of Single Cells Using Single-Cell Entropy (SCENT). Methods Mol Biol 1935, 125–139 (2019). [DOI] [PubMed] [Google Scholar]