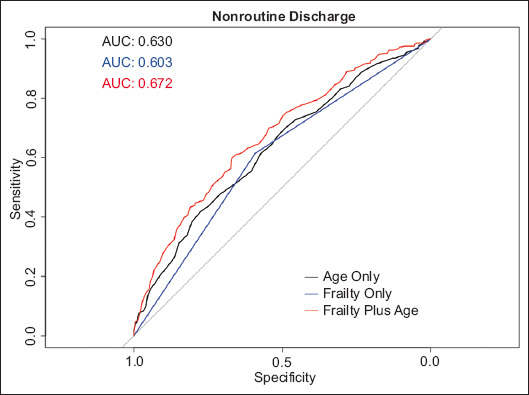
Figure 2.

Receiver operating characteristic (ROC) plot for prediction of nonroutine discharge status. The black ROC represents the logistic model using age alone as the primary predictor, the blue ROC represents the logistic model using frailty alone as the primary predictor, and the red ROC represents the logistic model using frailty status and age as the primary predictors. A noticeable increase in predictive power occurs when frailty is jointly considered for prediction of discharge status
AUC, area under the curve
