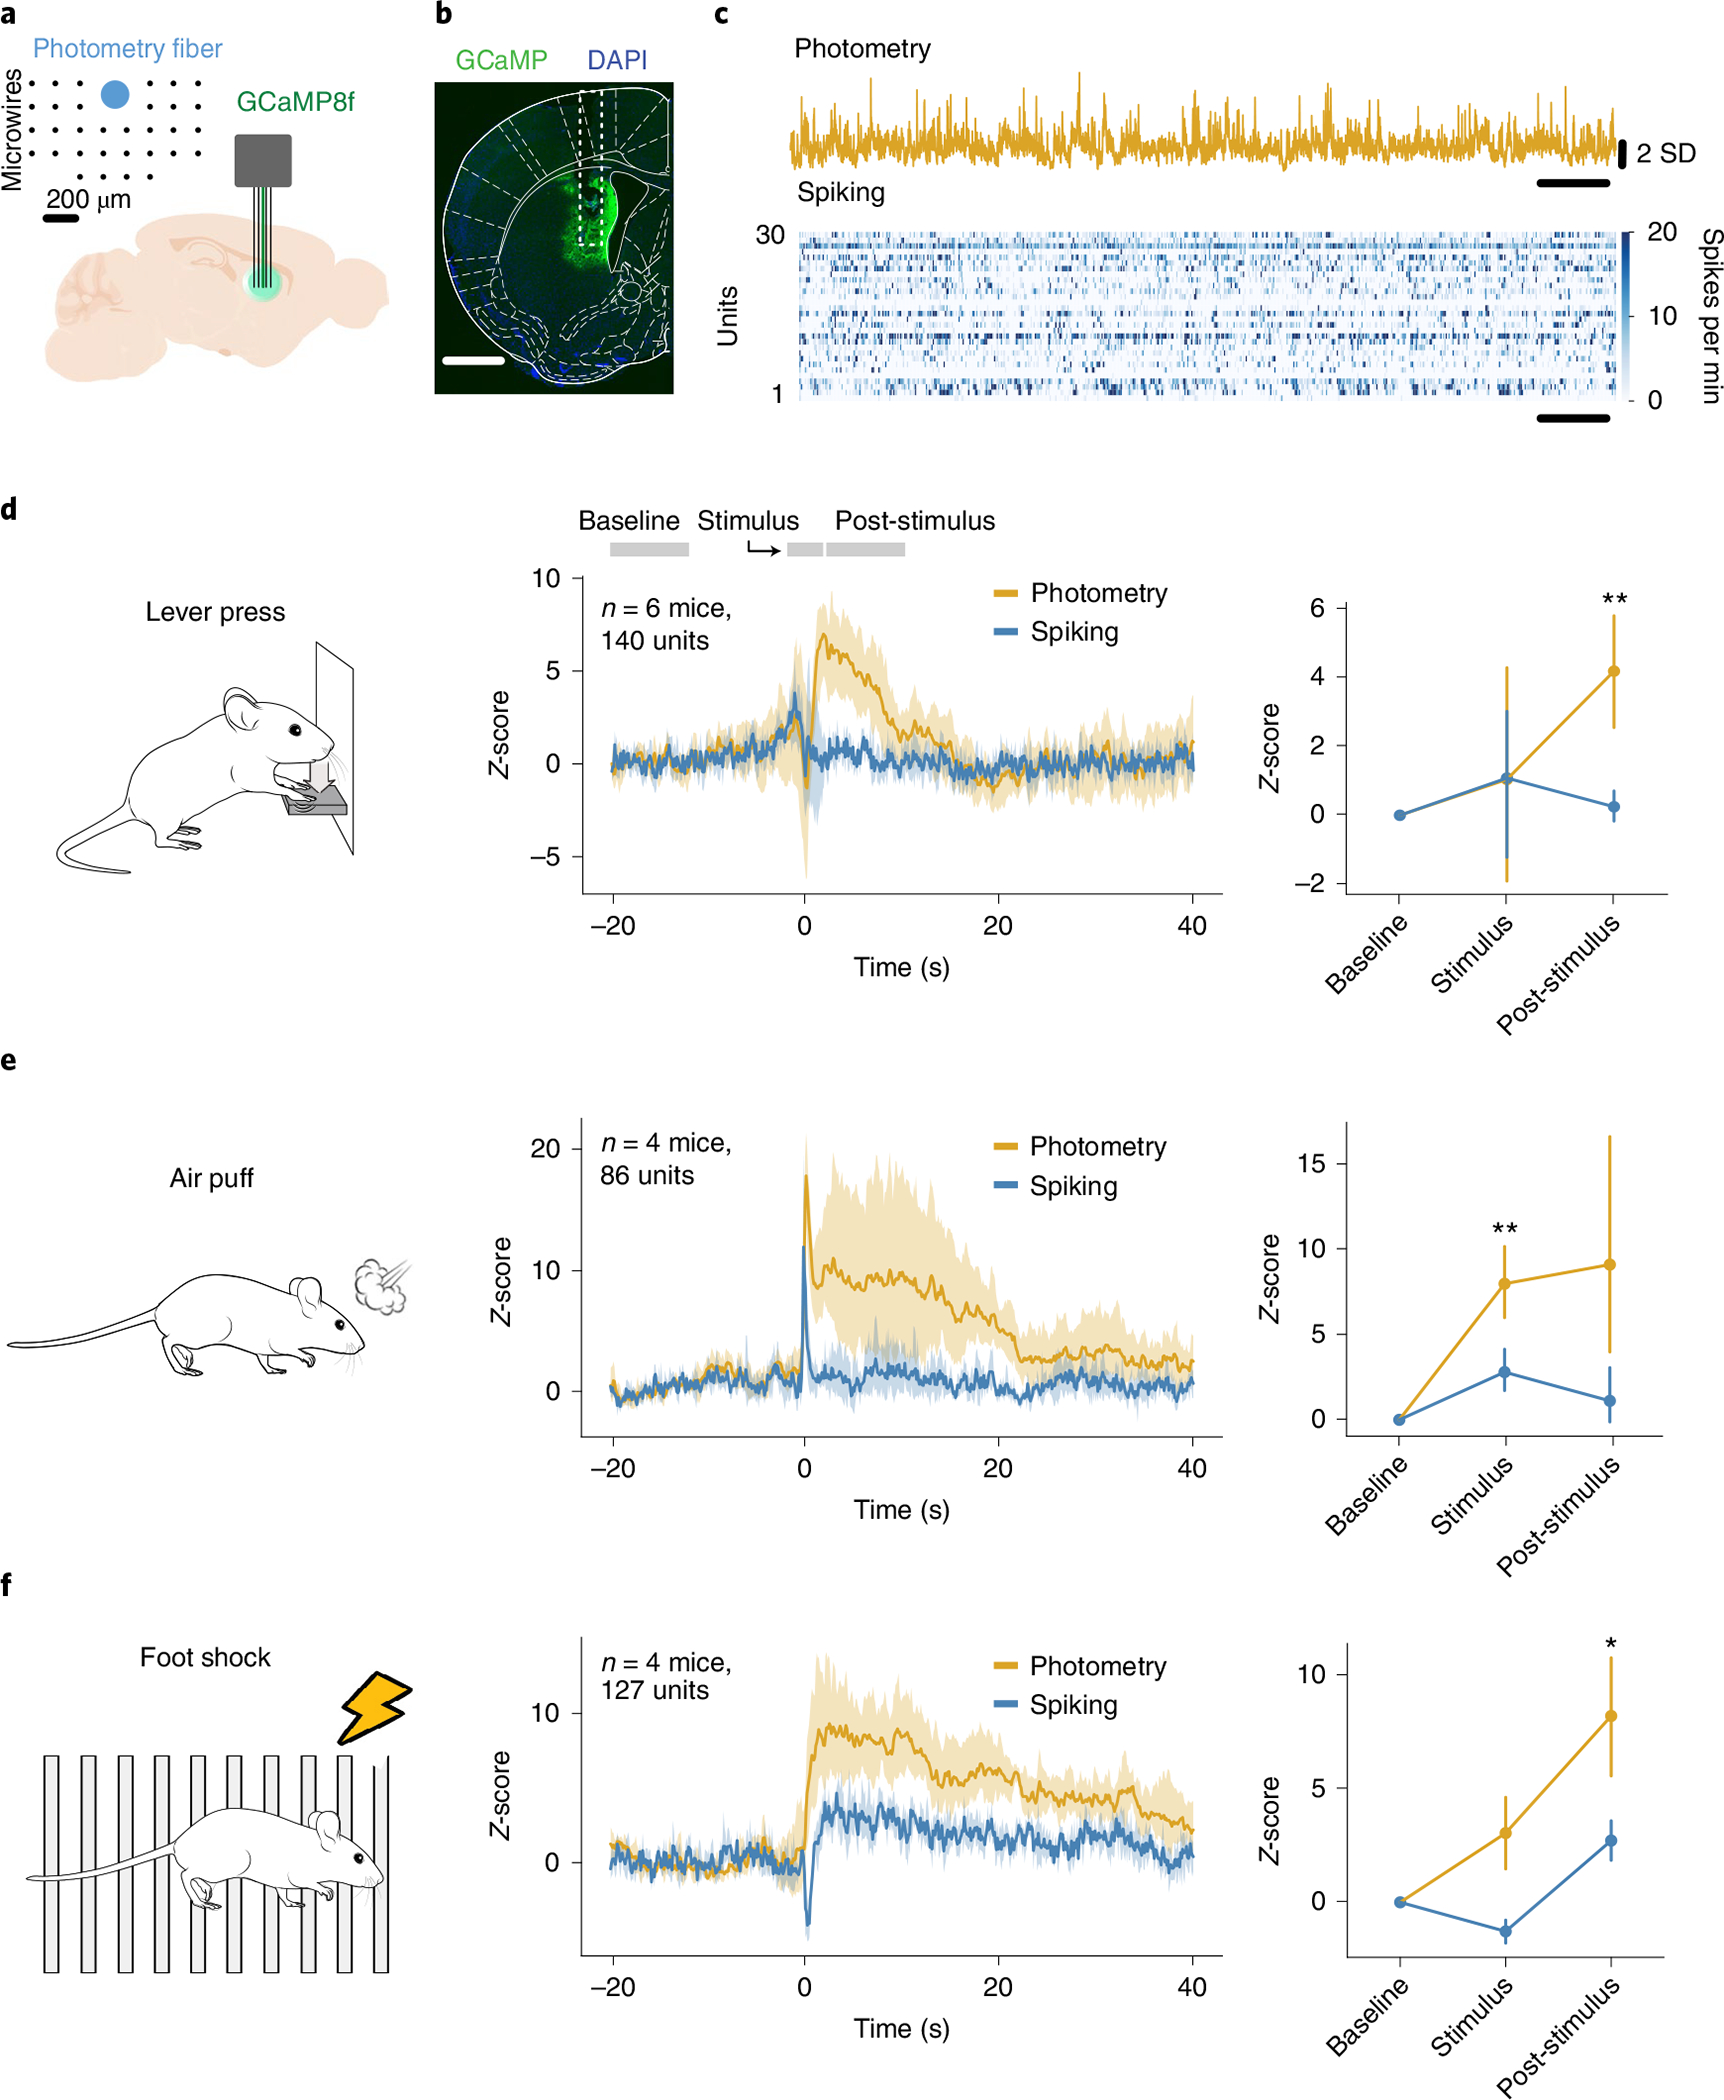
Fig. 1 |. Photometry and spiking activity show distinct responses to behavioral events.

a, Experimental setup: GCaMP8f was injected into the DMS of mice, and an array consisting of 32 microwires with a photometry fiber in the middle was implanted. Inset shows the geometry of the array. b, Representative example of viral injection and optic fiber implant. GCaMP8f expression is in green and DAPI is in blue. Scale bar, 1 mm. c, example of simultaneously collected calcium fiber photometry and spiking data. SD: standard deviation. d, Photometry (yellow) and average spiking (blue) activity around a lever press (n = 6 mice, 140 multiunits and single units). Left: task schematic. Middle: average photometry and spiking response. Right: average response in baseline, stimulus and post-stimulus intervals. Interaction between photometry signal and behavioral period: F = 3.06, P = 0.091. e, Same as d but for air puffs (n = 4 mice, 86 multiunits and single units). Right: Interaction between photometry signal and behavioral period: F = 6.16, P = 0.035. f, Same as d and e for 500 ms foot shocks at 0.7 mA (n = 4 mice, 127 multiunits and single units). Right: Interaction between photometry signal and behavioral period: F = 8.18, P = 0.019. Statistics in d–f, repeated measures ANOVA, with post-hoc two-tailed paired t-tests with Bonferroni corrections. *P < 0.05 and **P < 0.01 after corrections. Shaded regions represent 95% confidence intervals. error bars in d–f are standard deviations.
