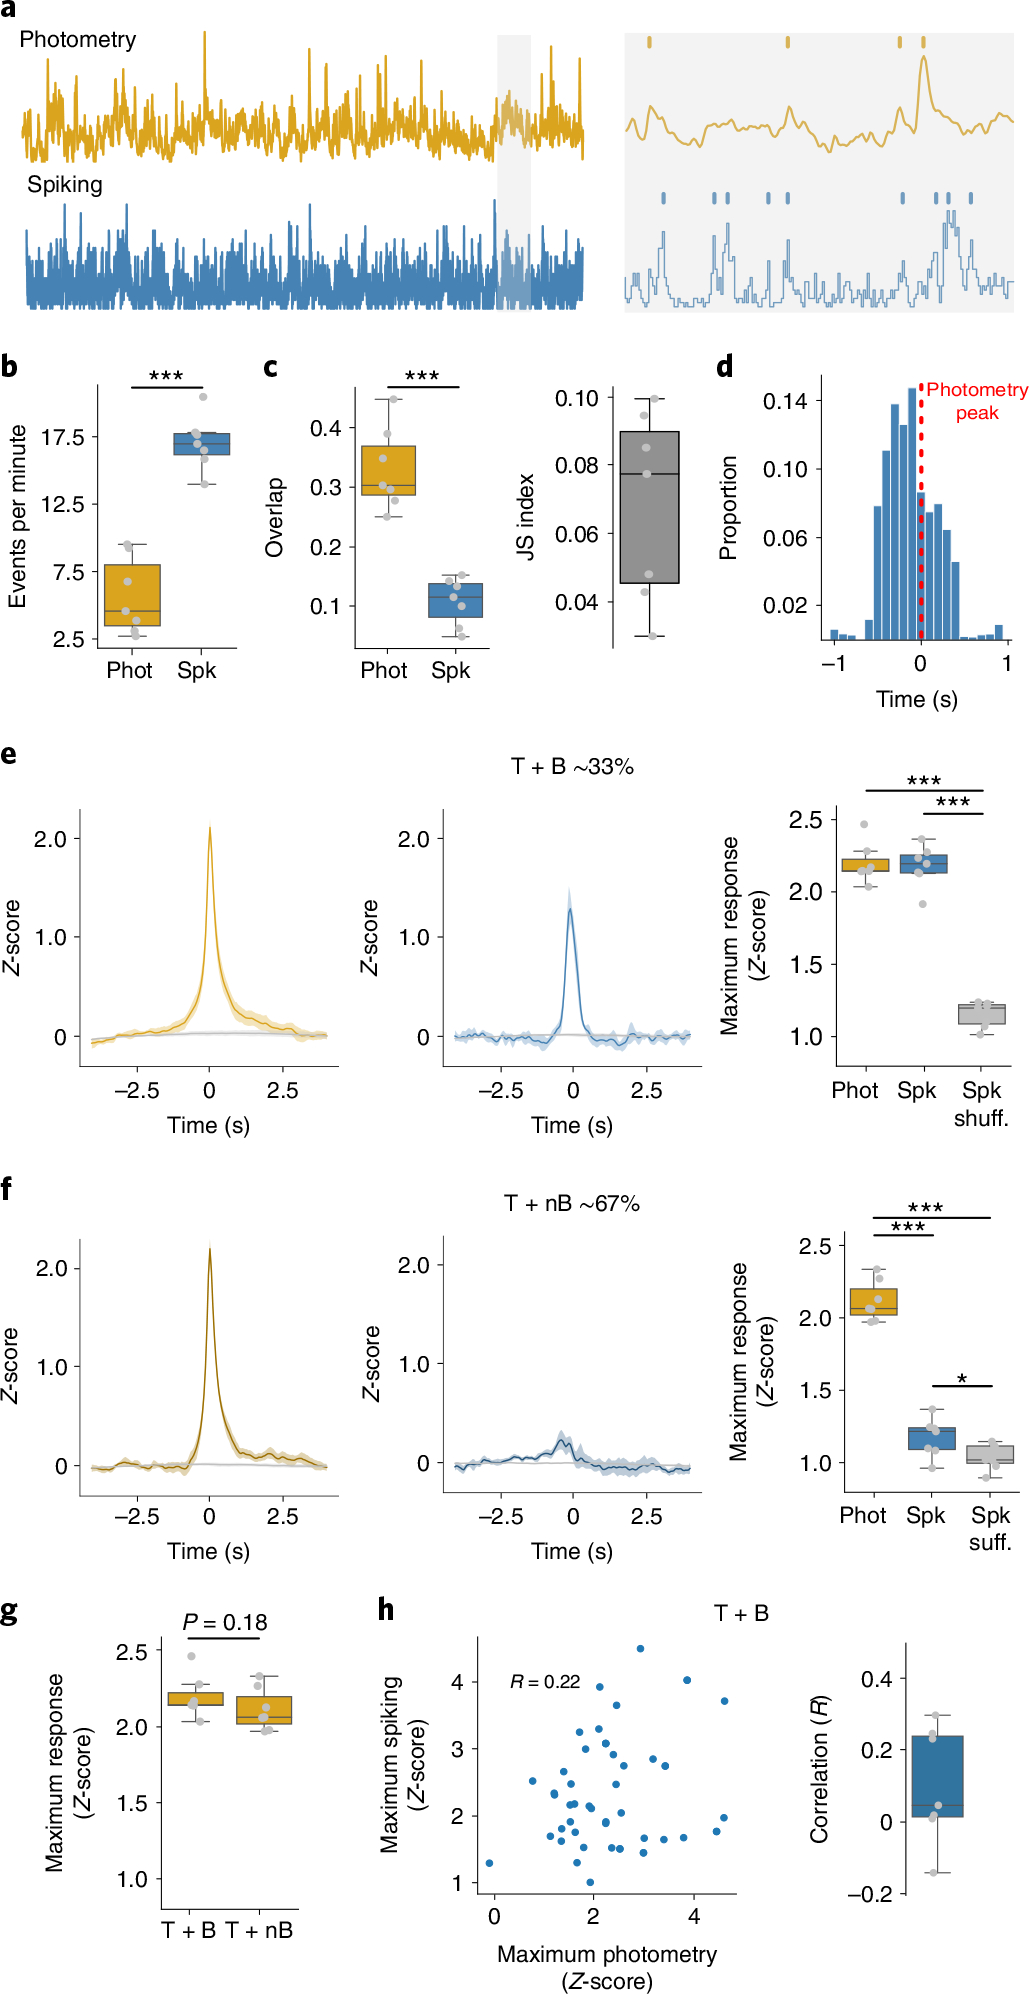
Fig. 2 |. Photometry does not reflect spontaneous changes in spiking.

a, Left: example of simultaneously recorded photometry and spiking activity. Right: identification of photometry transients and population bursts. b, Frequency of identified photometry (Phot) and spiking (Spk) events (P = 1.44 × 10⁻⁵). c, Left: similarity of photometry and spiking events (P = 2.58 × 10⁻⁴). Right: JS index. d, Delays to maximum spiking activity versus transients that overlapped with bursts (T + B). e, Left: average photometry response T + B (yellow) or shuffled timestamps (gray). Middle: average spiking response around T + B (blue) or shuffled timestamps (Spk shuff, gray). Right: average maximum photometry/spiking response (F = 213.0, P = 1 × 10⁻⁵). f, Same as e but for transients that did not overlap with a burst (T + nB). Right: F = 261.61, P = 1 × 10⁻⁵. g, Amplitude of photometry response around T + B and T + nB transients. h, Correlations between photometry and spiking responses. Left: representative example of 50 T + B photometry and spiking responses of one mouse. Right: average correlations, with the correlation coefficient given (R). For b and c, and right-hand graphs of f and h, n = 7 mice. Statistics: b, c and g, two-tailed paired t-tests. e and f, repeated measures ANOVA, with post-hoc two-tailed paired t-tests with Bonferroni corrections. *P < 0.05, **P < 0.01 and ***P < 0.001 after corrections. Shaded regions represent 95% confidence intervals. The central values of box plots denote the median, box bounds denote upper and lower quartiles and whiskers denote ±1.5 interquartile range.
