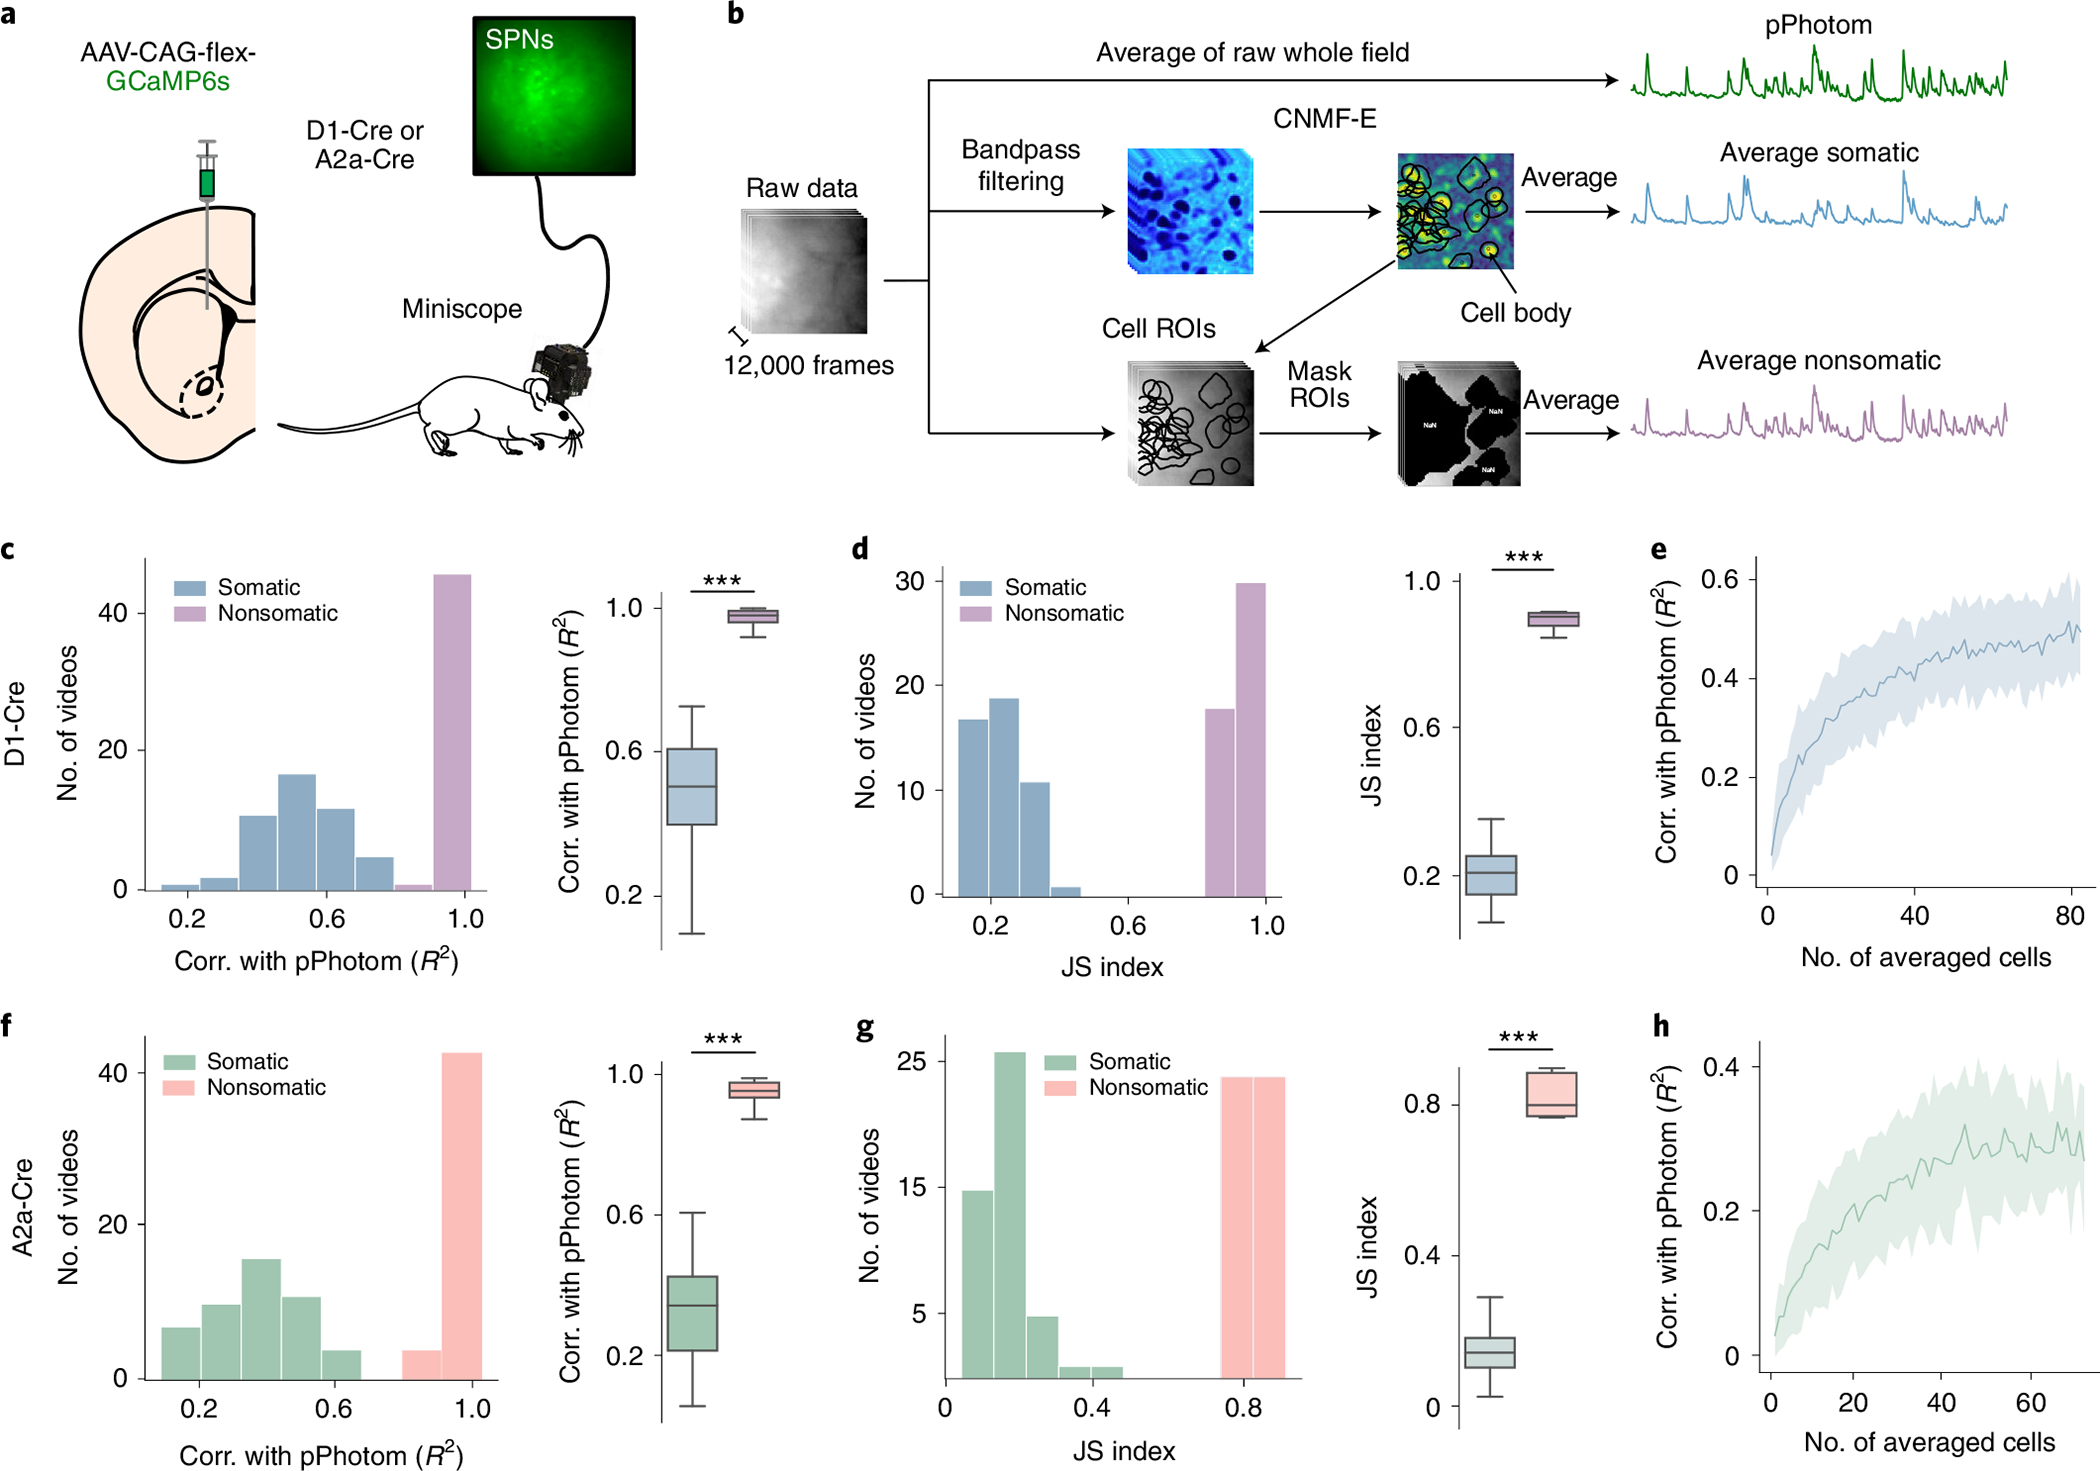
Fig. 3 |. pPhotom correlates with nonsomatic changes in calcium.

a, Experimental setup: Cre-dependent GCaMP6s was injected in the DMS of D1-Cre or A2a-Cre mice, and a miniature microscope was used to record neural activity from spiny projection neurons (SPNs). b, Segmentation of pPhotom, average somatic signal and average nonsomatic signals. c, Linear correlations (corr.) between photometry and somatic signals in direct pathway neurons. Left: correlation of the average somatic signals with pPhotom (n = 6 mice, 9 subfields/videos per mouse). Right: average correlation per mouse (n = 6 mice, P = 1 × 10⁻⁵). d, JS index between transients in the somatic signal and transients in pPhotom. Left: JS of somatic transients and pPhotom transients (n = 6 mice, 9 subfields/videos per mouse). Right: JS index per mouse (n = 6 mice, P = 1 × 10⁻⁵). e, Correlation between photometry and different numbers of somatic signals (n = 6 mice). f–h, Same as c–e for indirect pathway neurons (n = 6 mice, 9 subfields/videos per mouse). f, Right: P = 1 × 10⁻⁵. g, Right: P = 1 × 10⁻⁵. Shaded regions show 95% confidence intervals. The central values of box plots denote the median, box bounds denote upper and lower quartiles and whiskers denote ±1.5 interquartile range. Statistics for c, d, f and g, two-tailed paired t-tests. ***P < 0.001.
