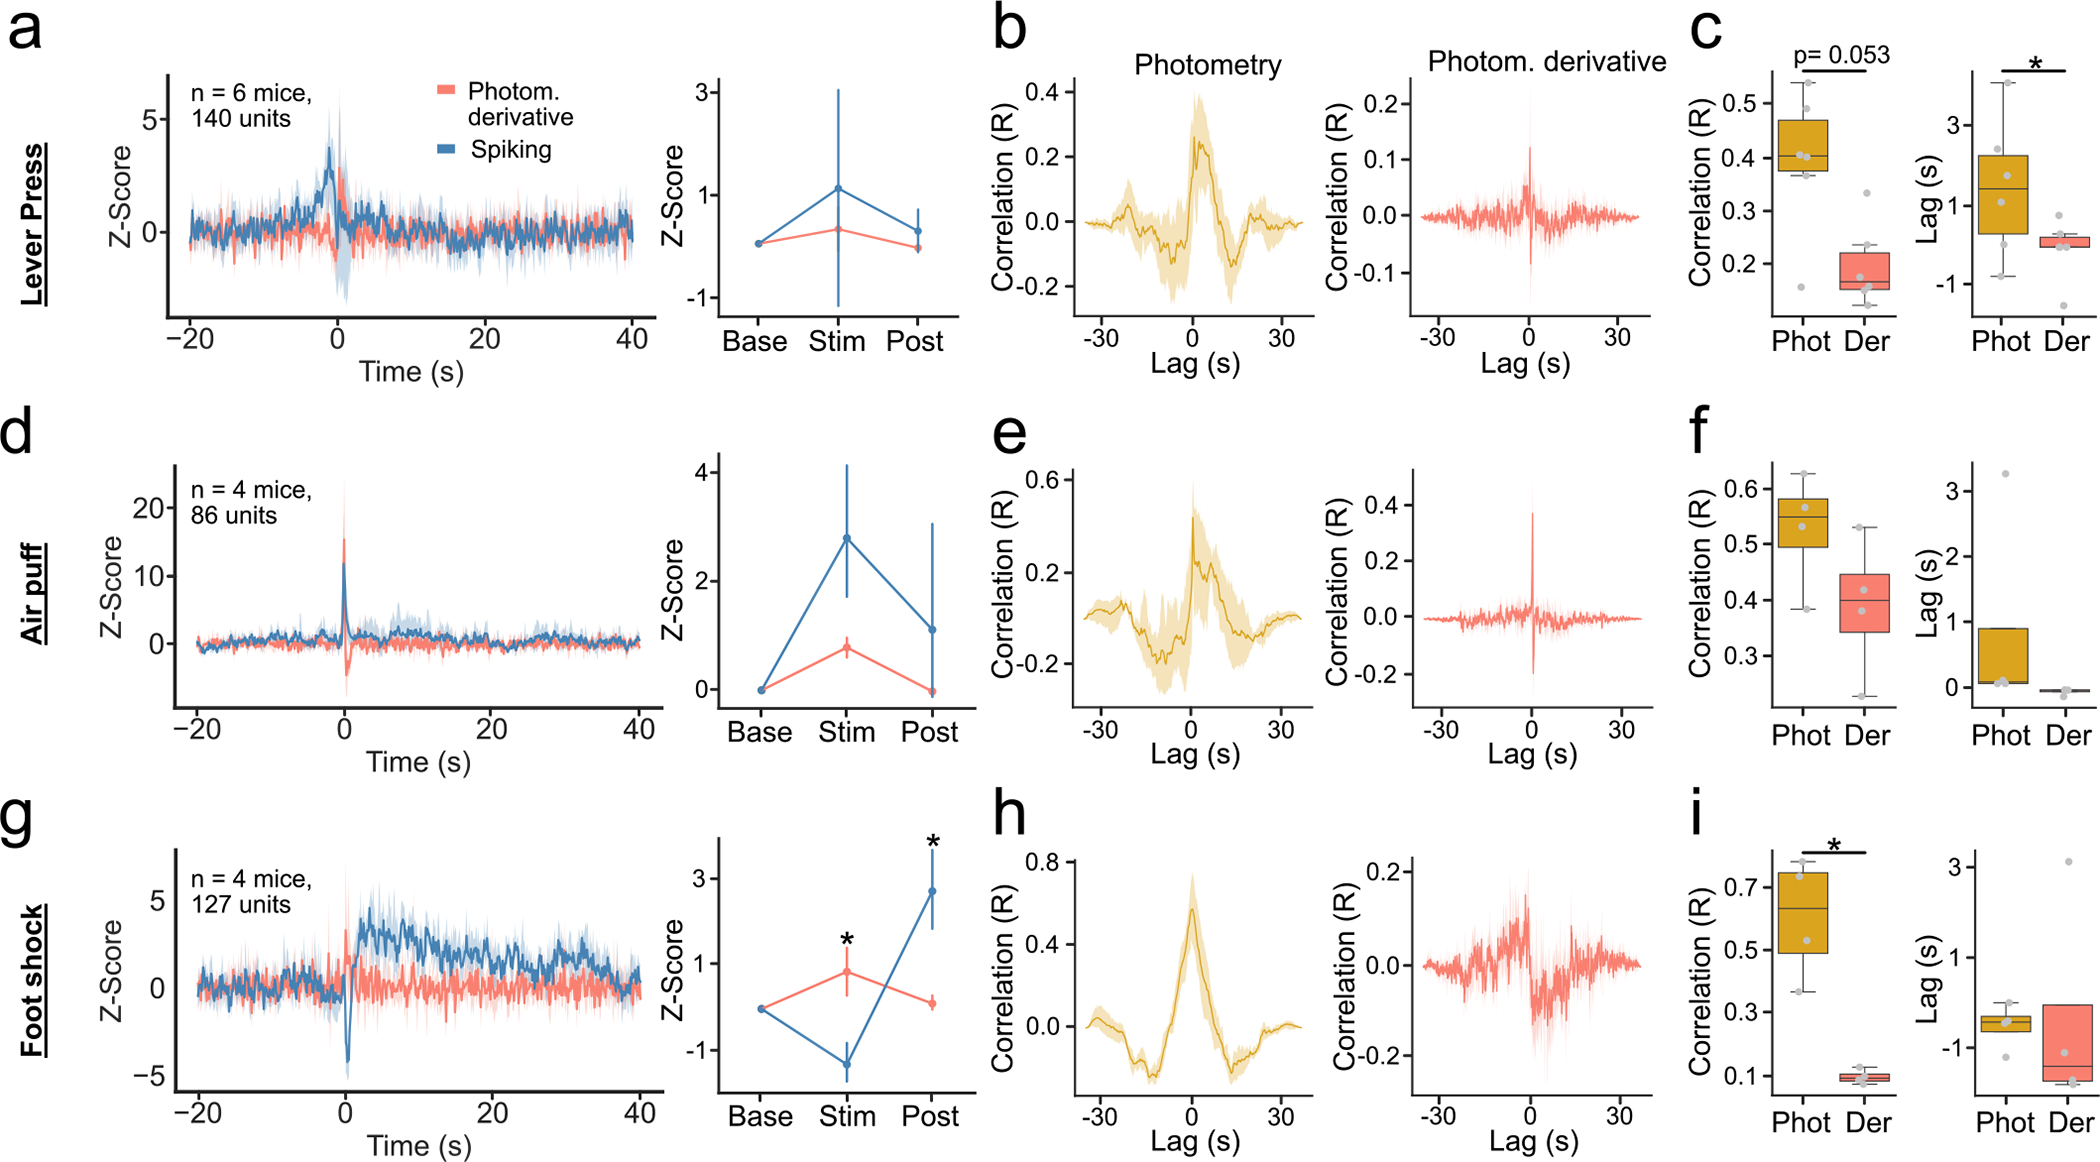
Extended Data Fig. 2 |. The time derivative of photometry (derivative) and spiking activity show distinct responses to behavioral events.

(a) Derivative and population spiking response around lever press (n = 6 mice). (Left) Average response. (Right) Average response in baseline, stimulus and post-stimulus intervals (Signal~Interval F-Value = 0.33, p-value = 0.724). (b) Cross-correlations between the response of the population spiking and photometry (Left) and derivative (Right). (c) (Left) Maximum correlation between photometry and spiking (yellow), and derivative and spiking (pink); p-value = 0.053. (Right) Latency to maximum correlation (n = 6 mice); p-value = 0.027. (d–f) Same as (a-c) for air puff stimulus (n = 4 mice). (d, Right) Signal~Interval F-Value = 4.1, p-value = 0.075. (g-i) Same as (a-c, d-f) for foot shock stimulus (n = 5 mice); i-right: p-value = 0.013. (g, right) Signal~Interval F-Value = 22.22, p-value = 0.002. For quantification of (a,d,f), we ran a repeated measures ANOVA, with post-hoc two-tailed paired t-test with bonferroni corrections. For quantification of (c,f,h), we ran 2-tailed paired t-tests. * denotes p < 0.05. Line plots show mean±95% confidence interval. error bars in (a,d,g right) denote standard deviation. Box plots central value denotes the median, box bounds denote upper and lower quartiles and whiskers denote ±1.5 interquartile range.
