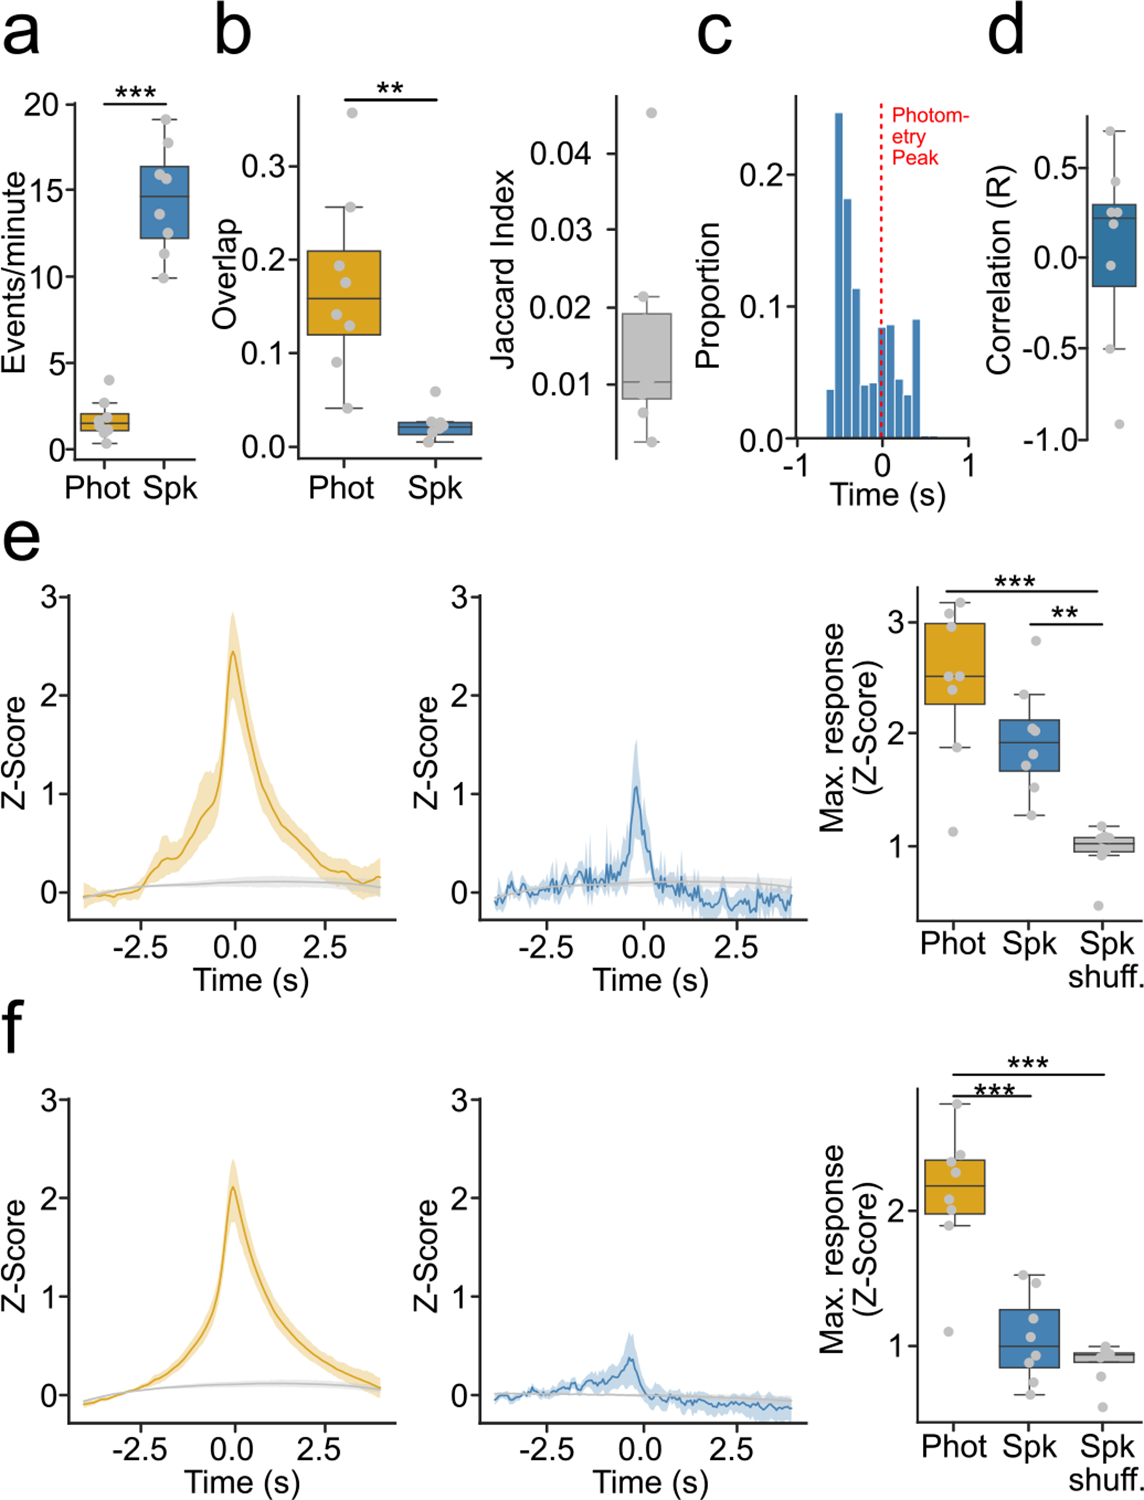
Extended Data Fig. 4 |. GcaMP6s fiber photometry reflects only a small proportion of spontaneous changes in spiking activity.

(a) Frequency of identified events in photometry or spiking (n = 8 mice, p-value = 1.75 × 10⁻⁵). (b) Similarity of photometry and spiking events (n = 8 mice). (Left) Proportion of overlap between photometry and spiking events (p-value = 2.36 × 10⁻⁴). (Right) Jaccard similarity. (c) Time course of maximum spiking activity around transients that overlapped with bursts (T + B). (d) Average correlations between photometry and spiking responses atound T + B. (e) Photometry and spiking response around T + B or shuffled timestamps. (Left) Average photometry response T + B (yellow) or shuffled timestamps (gray). (Middle) Average spiking response around T + B (blue) or shuffled timestamps (gray). (Right) Average maximum photometry/spiking response (n = 8 mice, F-value = 20.68, p-value = 1 × 10⁻⁵). (f) Same as (e) but for transients that did not overlap with bursts (T + nB) (Right) (n = 8 mice, F-value = 41.63, p-value < 0.0001). For quantification of (a,b), we ran two-tailed paired t-tests. For quantification of (e,f), we ran a repeated measures ANOVA, with post-hoc two-tailed paired t-tests with bonferroni corrections. * denotes p < 0.05, ** denotes p < 0.01, *** denotes p < 0.001 after corrections. Shaded regions in (f) represent 95% confidence intervals. Box plots central value denotes the median, box bounds denote upper and lower quartiles and whiskers denote ±1.5 interquartile range.
