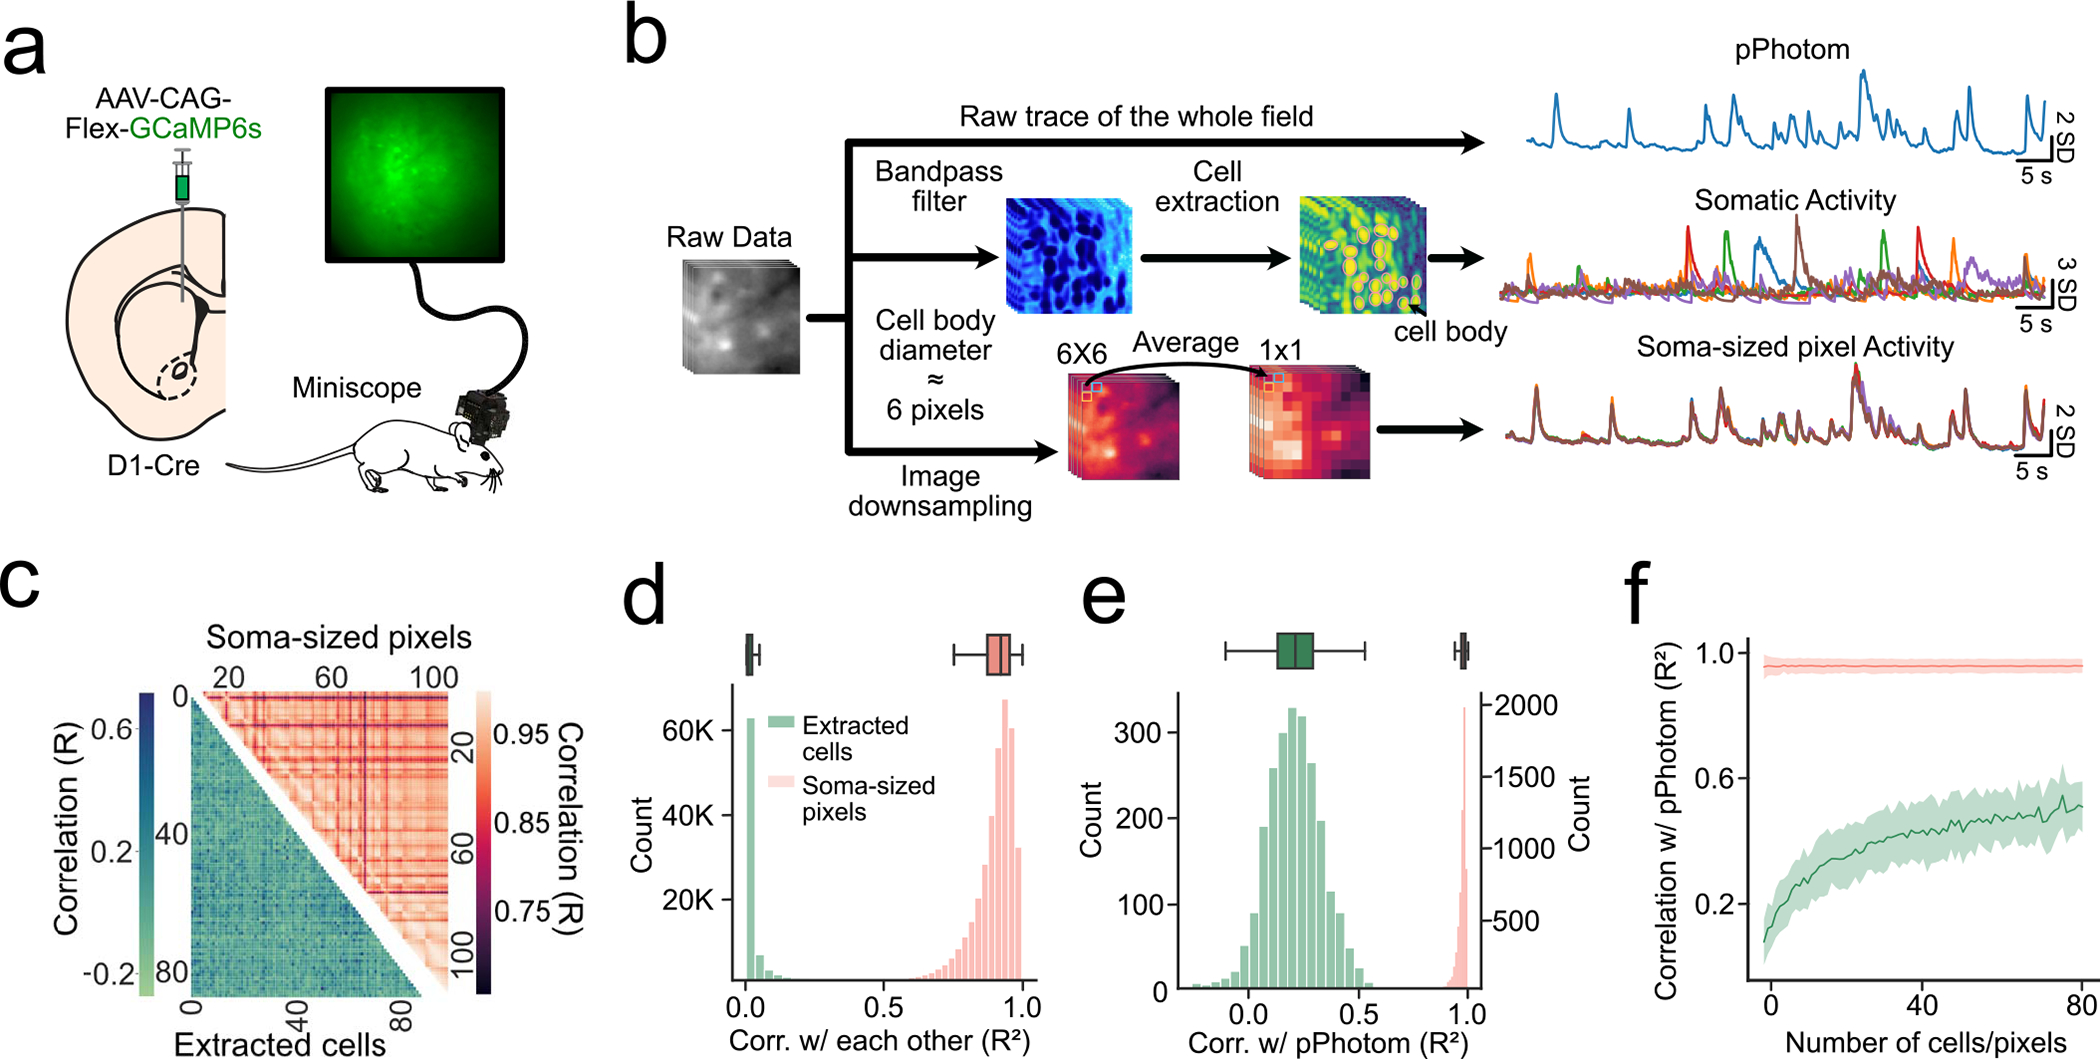
Extended Data Fig. 5 |. pPhotom correlates with whole-field changes in fluorescence signal.

(a) Experimental setup: D1-Cre mice were injected with Cre-dependent GCaMP6s in the DMS and imaged with a headmounted miniscope. (b), three signals were extracted from raw miniscope movies: 1) average of the entire field (pPhotom), 2) somatic signals (via CNMFe cell extraction), and 3) soma-sized regions (6 × 6 pixels) throughout the field. (c) Representative heatmap showing correlations among extracted somatic signals (bottom), and among each soma-sized pixel (top). (d) (Bottom) Distribution of all correlations among extracted cells or soma-sized pixels (n = 6 mice, 9 subfields/movies per mouse, 80 ± 12 extracted cells or soma-sized pixels per subfield). (Top) Boxplot showing distribution of correlations among extracted cells or soma-sized pixels per mouse (n = 6 mice). (e) (Bottom) Distribution of all correlations between extracted cells or soma-sized pixels with pPhotom (n = 6 mice, 9 subfields/movies per mouse, 80 ± 12 extracted cells or soma-sized pixels per subfield). (Top) Boxplot showing distribution of correlations between extracted cells or soma-sized pixels with pPhotom per mouse (n = 6 mice). (f) Correlation between extracted cells or soma-sized pixels with pPhotom as more cells or pixels were averaged. Shaded regions represent 95% confidence intervals. Box plots central value denotes the median, box bounds denote upper and lower quartiles and whiskers denote ±1.5 interquartile range.
