
Extended Data Fig. 6 |. Out-of-focus cells do not contribute substantially to the pPhotom signal.
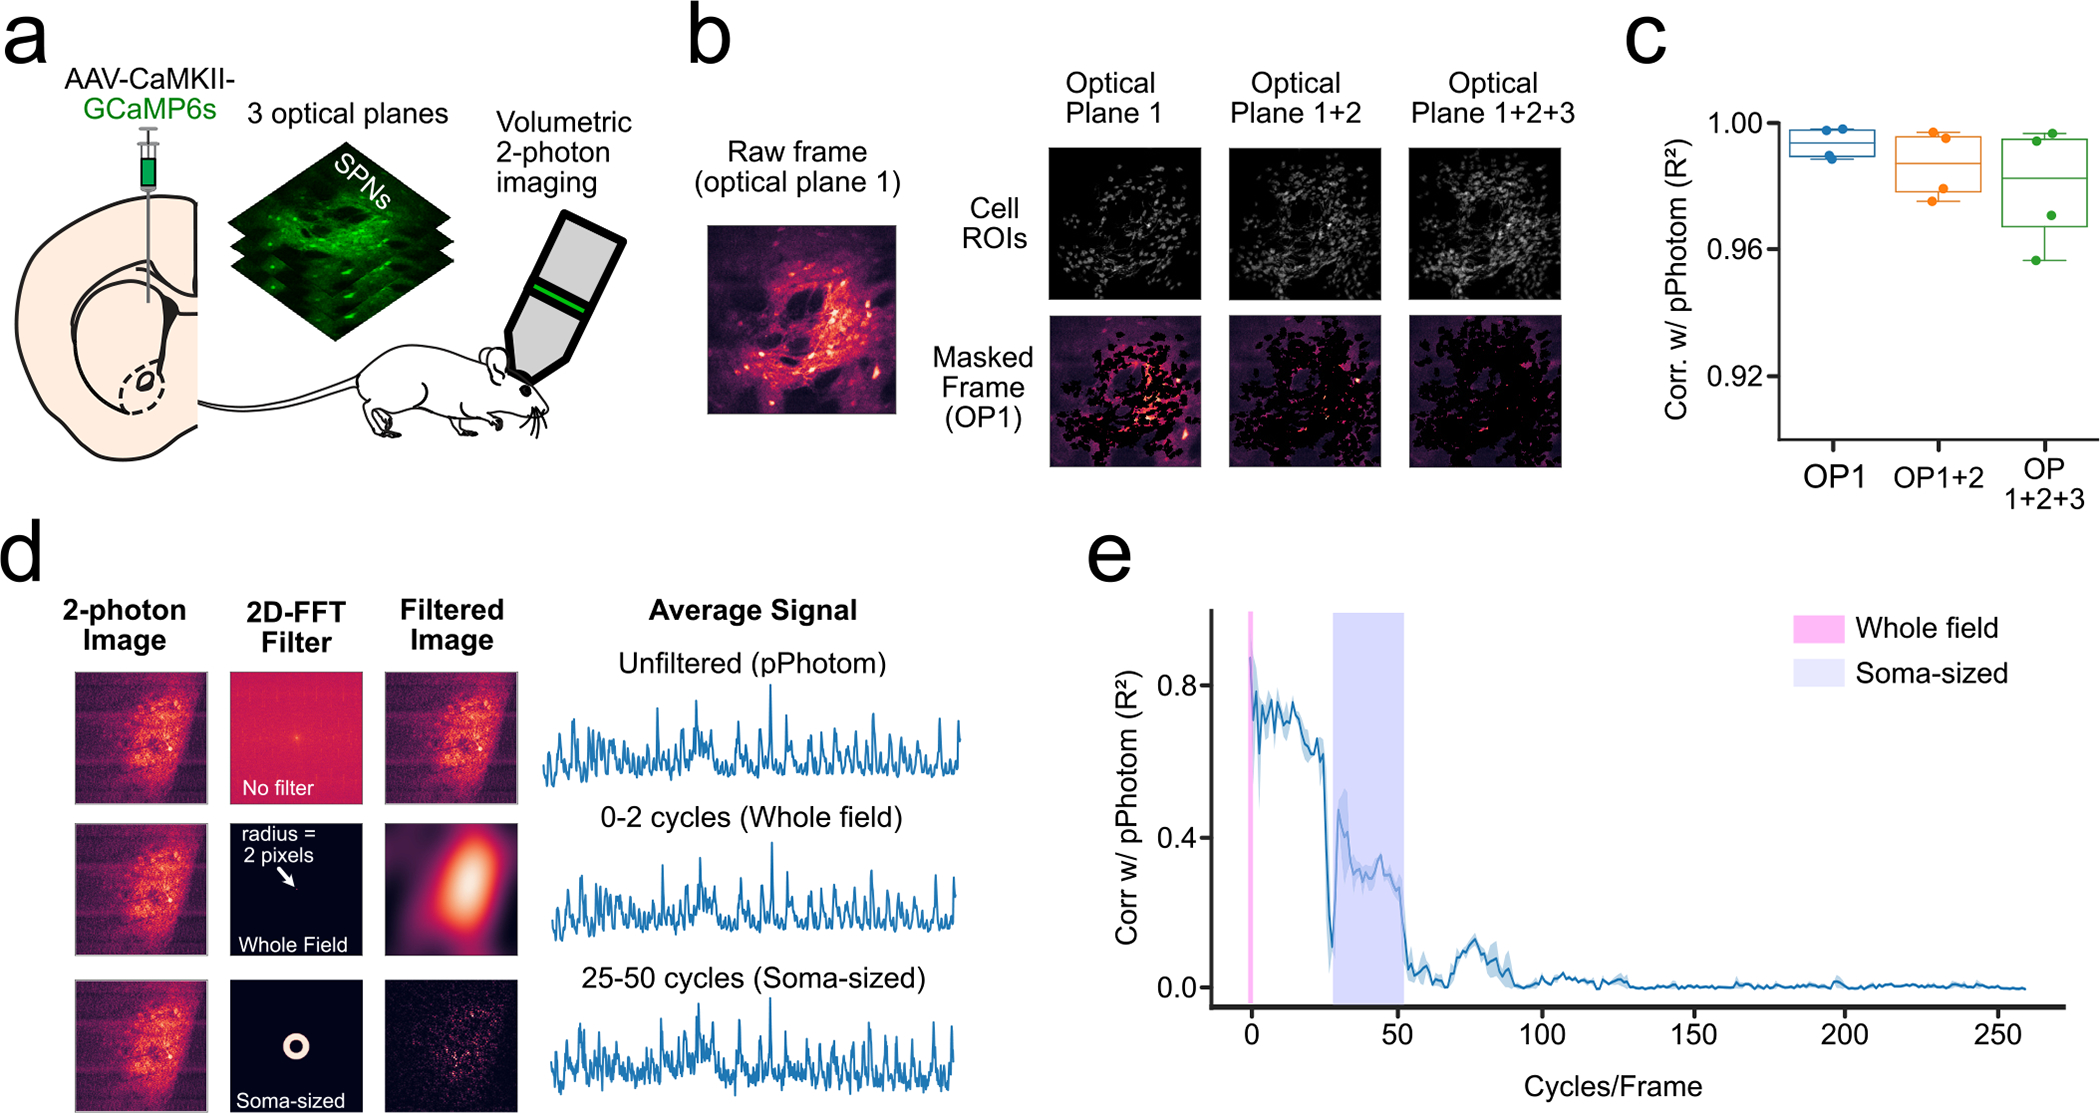
(a) Experimental set-up: we expressed GCaMP6s in the DMS and performed volumetric two-photon imaging of three consecutive optical planes. (b) The raw movie from optical plane 1 (OP1) was masked with somatic ROIs from either optical plane 1 only (OP1), or optical plane 1 and optical plane 2 (OP1 + 2), or from the three optical planes (OP1 + 2 + 3). (c) Correlations between the average signal of the raw movie (pPhotom) and the masked movies (n = 4 mice). (d) 2D-FFts were used to test the contribution of different spatial frequencies. Top row shows an example of the transformation between the time and space domain without applying any bandpass filter. Bottom row shows the same process but applying a bandpass filter that includes only the signal that is between 0 and 2 cycles per frame (full-frame). (e) Correlations between the pPhotom signal and signal from different spatial frequencies (bin-width = 2 cycles/frame). Line plots show mean±95% confidence interval. Box plots central value denotes the median, box bounds denote upper and lower quartiles and whiskers denote ±1.5 interquartile range.