Figure 5.

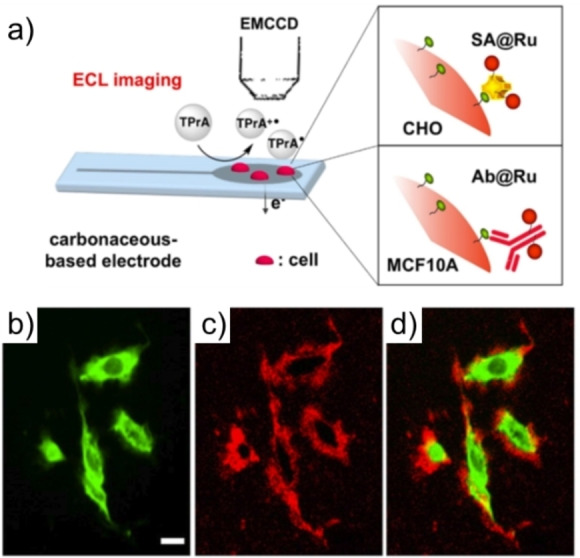
Schematic illustration of imaging single cells by ECL microscopy (a). PL (b), ECL (c) and the overlay (d) images of the same region of interest. Reproduced with permission from Ref. [46] Copyright 2017, American Chemical Society.

Schematic illustration of imaging single cells by ECL microscopy (a). PL (b), ECL (c) and the overlay (d) images of the same region of interest. Reproduced with permission from Ref. [46] Copyright 2017, American Chemical Society.