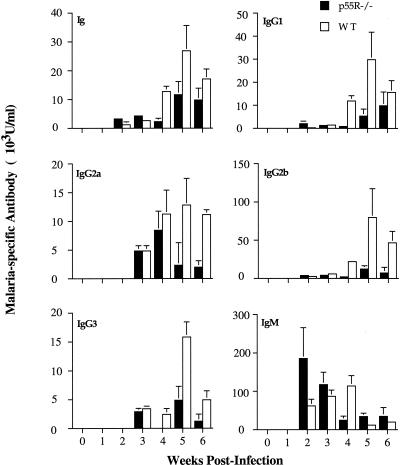
FIG. 3.
Isotypes of malaria-specific antibodies during a primary infection in female p55R−/− (■) and WT (□) mice. Mice were infected with 105 P. chabaudi chabaudi (AS) parasites i.p. Plasma samples were collected before and for 4 weeks postinfection. Data are shown as arbitrary units of antibody of a given isotype as calculated from a standard curve of hyperimmune serum (see Materials and Methods). The histogram bars represent the geometric mean of the concentration of antibody, and the vertical lines are the SEM values for eight individual mice. For clarity, SEM values of <10% of the mean are not shown.

