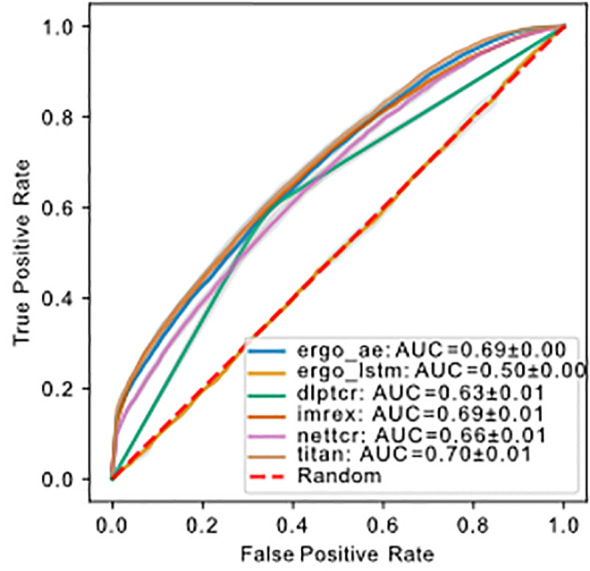
Figure 4.

ROC of models predicting binding of TCR-pMHC trained and tested on using uniform splitting. The dashed red line indicates performance of random guessing. ROC curve for DLpTCR looks “linear”, because DLpTCR outputs a binary and not a continuous probability.
