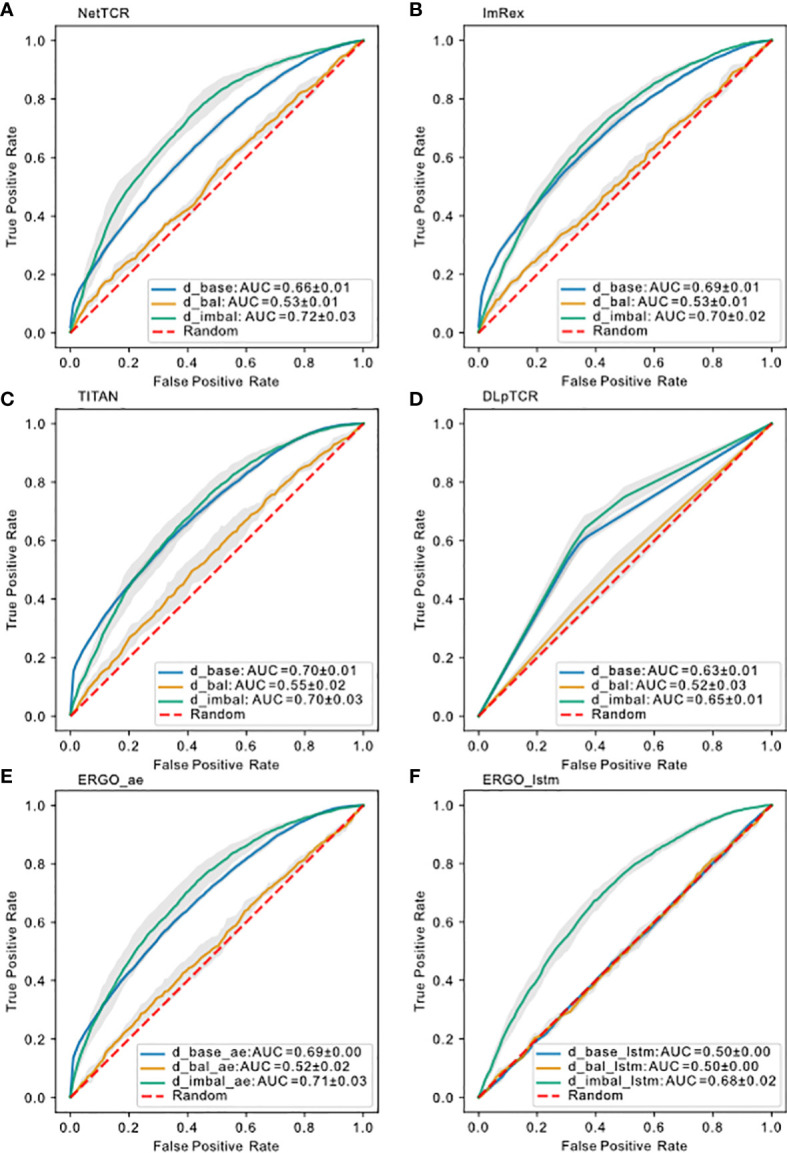
Figure 6.

Model performance on different datasets using uniform splitting. ROC curve for (A) NetTCR-2.0, (B) ImRex, (C) TITAN, (D) DLpTCR (Curves looks “linear”, because DLpTCR outputs a binary and not a continuous probability), (E) ERGO Autoencoder model and (F) ERGO LSTM model using , and . The dashed red diagonal line indicates performance for random guessing.
