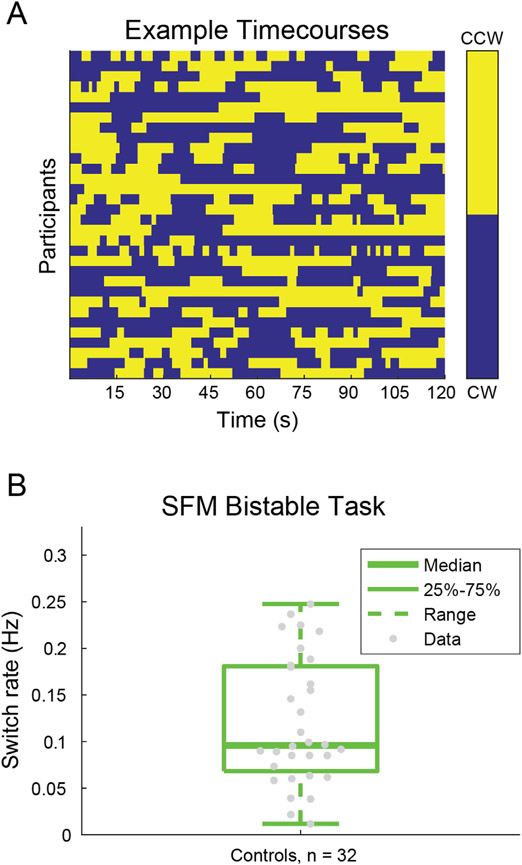
Fig. 10.
SFM results. A) Example behavioral response time courses from the bi-stable task, showing perceived switches between clockwise (CW, blue) and counterclockwise (CCW, yellow) rotation in depth. Data from a single 120 s block are shown for n = 32 control participants. B) Bi-stable switch rates from the same group of participants. Thick line shows group median, box shows 25-75%, whiskers show 1.5 x interquartile range, dots show individual participants.

