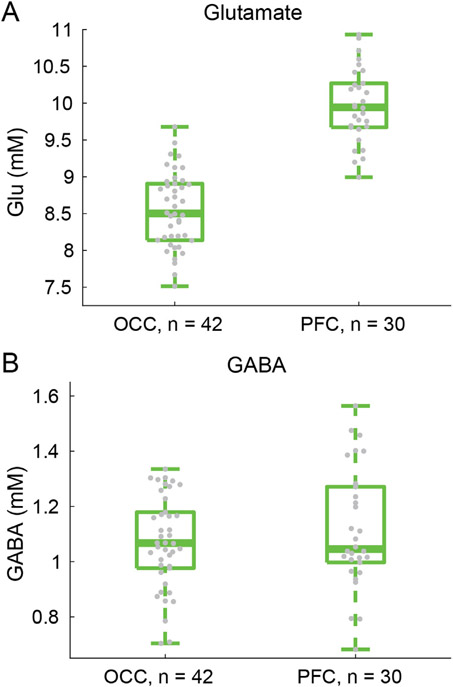
Fig. 13.
MRS results showing (A) glutamate and (B) GABA concentrations in OCC and PFC, from a group of n = 42 & 30 participants, respectively. Fewer PFC data sets were collected due to a delay in hardware availability, as noted in the Methods. Thick lines show group medians, boxes show 25-75%, whiskers show 1.5 x interquartile range, gray dots show data points from individual participants.

