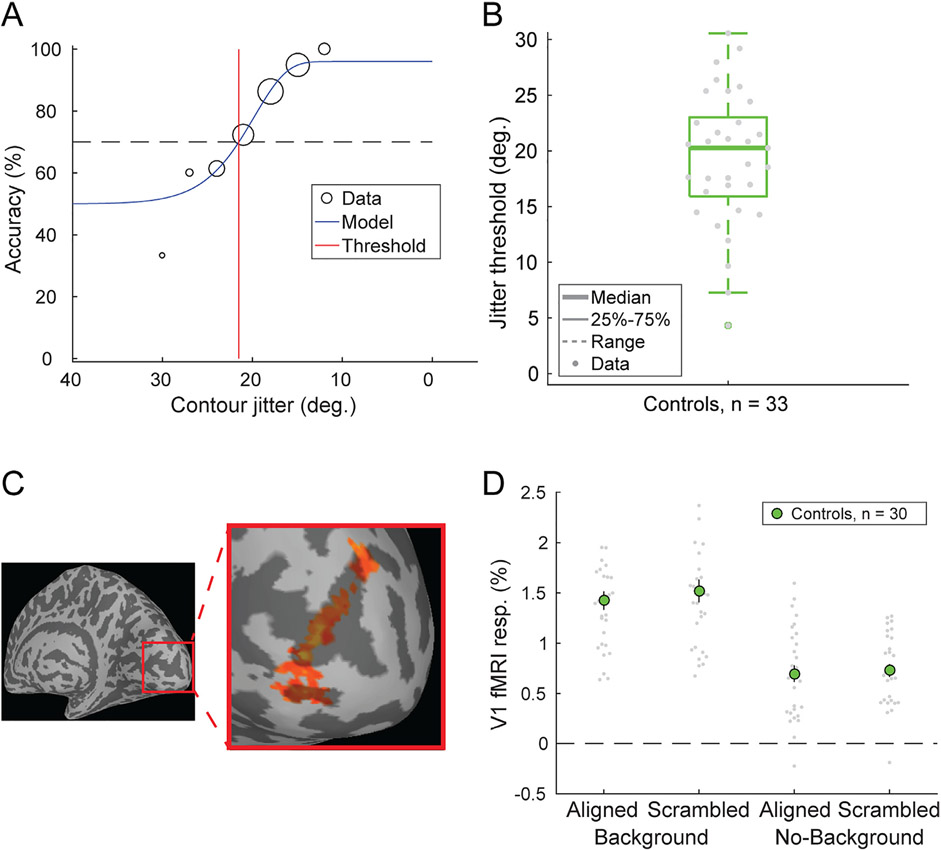
Fig. 9.
COP task results. A) Example COP psychophysical data (black, size = # of trials) from a single participant were fit with a Weibull function (blue) to obtain a jitter threshold (red), reflecting 70% contrast discrimination accuracy (dashed line). B) Jitter thresholds for n = 33 controls. Thick line shows median, box shows 25-75%, whiskers show 1.5 x interquartile range, gray dots show individual data points. C) COP functional localizer data from area V1 in the right hemisphere from an example participant. Color indicates statistical significance from a Fourier analysis (Engel, 1997) showing voxels selective for the COP localizer stimulus > blank. D) COP fMRI responses from retinotopic contour ROIs in area V1 across 4 stimulus conditions in a group of n = 30 controls. The presence of background stimuli increased the fMRI response (as expected, with more stimuli on the screen), whereas we saw little effect of contour alignment in the V1 fMRI response.

