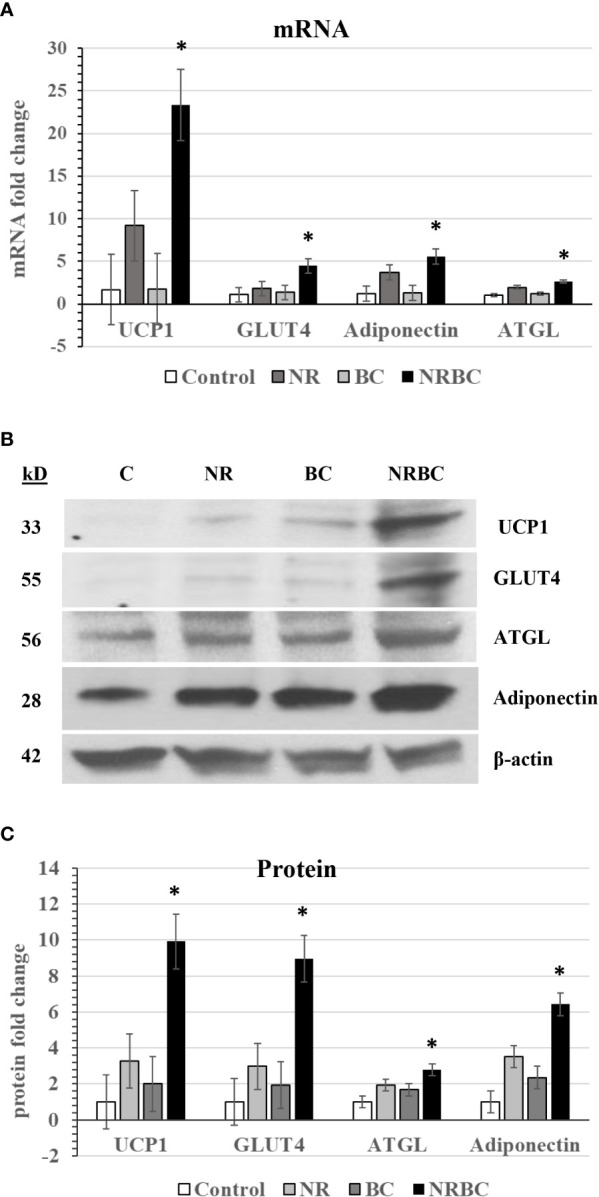
Figure 2.

NR and BC synergistically induce metabolism genes (A) mRNA levels (B) Western Blots of Protein levels (C) Protein levels were measured with β-actin as loading control. Adipocytes from three or more donors with obesity were treated for seven days. mRNA data are expressed as least squares means ± standard error. Synergy for mRNA was calculated as: sum of differences ((NR- Control) + (BC - Control)) vs (NRBC - Control). *p < 0.05 for synergy. NR, Naringenin; BC, beta carotene; NRBC, naringenin and beta carotene.
