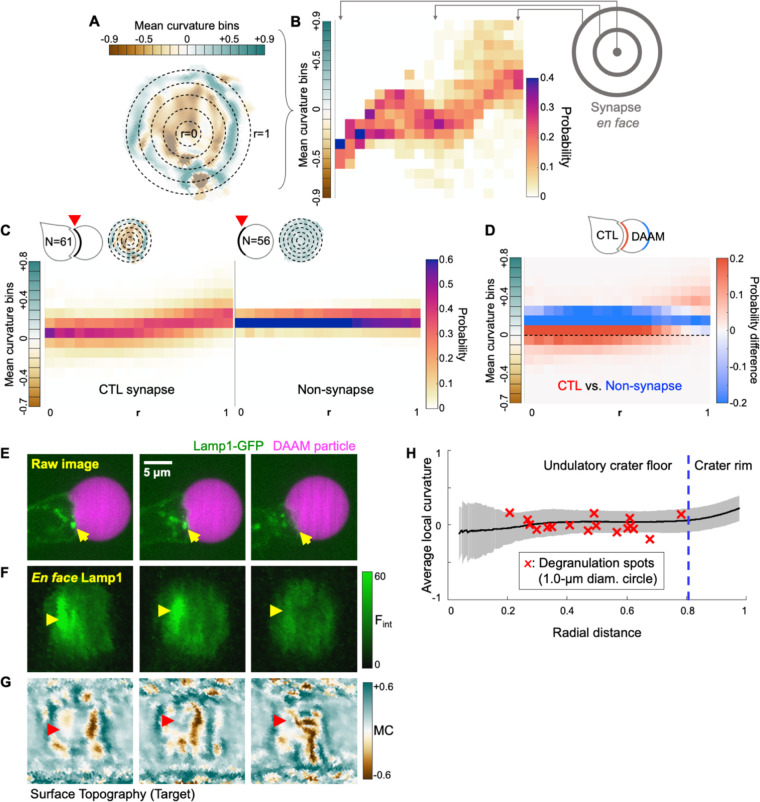
Figure 2. Radial analysis of DAAM particle curvature and degranulation position.
(A) Synapses were partitioned into radial bins starting from the center of the contact and proceeding to the periphery. A representative synapse is shown, with positive curvature in blue-green and negative curvature in brown. (B) Curvature plot derived from the synapse in A. Vertical strips contain the probability distributions of curvatures within each radial bin, proceeding from the center (left) to the periphery (right). (C) Mean radial curvature plots derived from CTL synapses (, left) and non-synapse control surfaces (, right). Representative topographies are shown in the top left of each plot. (D) Difference plot determined by subtracting the non-synapse curvature distribution from the CTL curvature distribution. Curvature domains are colored red and blue if they are over-represented in CTL synapses and non-synapse controls, respectively. Dotted line indicates 0 curvature (flat). (E-G) Time-lapse montages of a representative Lamp1-eGFP expressing OT-1 CTL interacting with an coated DAAM particle. (E) Side view of the degranulation event. (F) En face view of Lamp1-eGFP within 0.5 μm of the particle surface. In E and F, yellow arrowheads denote a lytic granule that docks at the cell-target interface and disappears, indicating degranulation (). (G) Cropped world map projection of the underlying particle surface, shaded by mean curvature. The degranulation zone is indicated by red arrowheads. (H) Mean curvature (black line ± SD in gray) plotted as a function of normalized distance from the center of the contact. Mean curvatures within a 1 μm diameter zone around each degranulation event were calculated and plotted against radial distance as red X’s ( cells with degranulation events).

