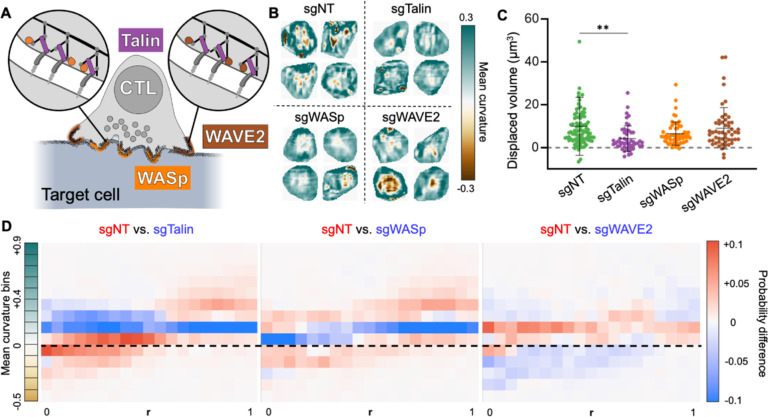
Figure 3. Compressive strength and protrusive activity distinguish lytic from non-lytic synapses.
(A) Schematic diagram highlighting the cytoskeletal proteins targeted by CRISPR/Cas9 in this data set. WASp and WAVE2 drive protrusive actin polymerization, while Talin couples integrins to the F-actin cytoskeleton. (B-D) OT-1 CTLs expressing Cas9 were transduced with retroviruses expressing the indicated sgRNAs or non-targeting control gRNA (sgNT), and then imaged together with DAAM particles coated with pMHC and ICAM-1. (B) Cropped views of representative synapses from each experimental group. (C) Deformation volume of CTL-DAAM particle contacts ( cells). ** denotes , calculated by multiple t-test with Tukey’s correction. Error bars denote SD. (D) Difference plots of radial curvature distribution, obtained by subtracting the mean curvature distributions of the indicated mutant CTLs from the mean curvature distribution of sgNT control CTLs. Curvature domains are colored red and blue if they are over-represented in sgNT and mutant CTLs, respectively. Dotted line indicates 0 curvature (flat).

