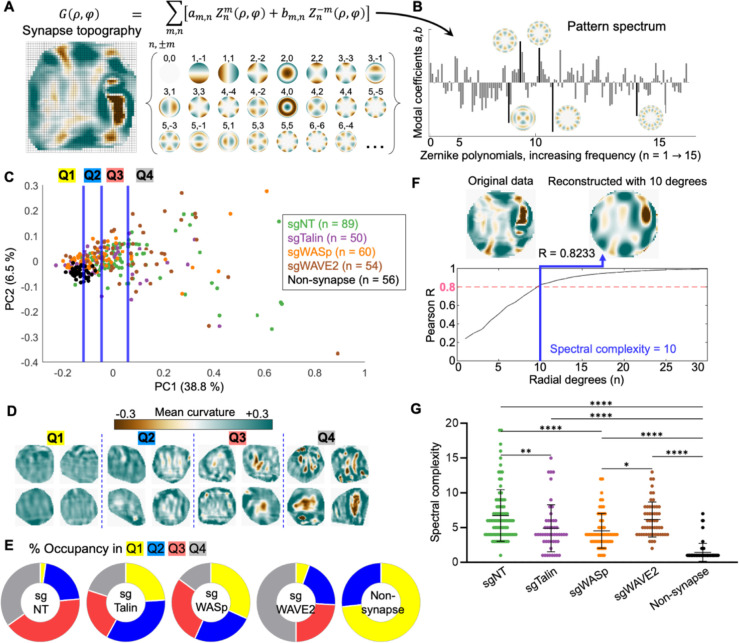
Figure 4. Z-pattern spectral analysis links cytolytic activity to topographical complexity and radial asymmetry.
(A) Synapse topographies (curvature maps) can be expressed as a linear combination of Zernike polynomials. Specific Zernike functions are classified by radial degree and angular order . (B) Spectral representation of the topography shown in A. Bars represent the weighting coefficients for all Zernike modes in the first 15 orders. Representative functions are shown next to their corresponding bars, which are highlighted in black. (C) Topographies of the indicated CTL synapses, together with non-synapse controls, were transformed into rotationally degenerate Z-pattern spectra and then visualized by PCA. Data points were separated into quartiles (divided by the blue lines) for downstream analysis. (D) Cropped views of representative synapses from each quartile in C. (E) Distribution of each experimental group across the quartiles of PC space. (F) Spectral complexity is defined as the minimum number of Zernike degrees required to reconstruct a topography to an accuracy of Pearson . The topography shown has spectral complexity = 10. (G) Spectral complexity metrics for the indicated mutant and sgNT CTLs, along with non-synapse controls. *, **, and **** denote , and , calculated by multiple t-testing with Tukey’s correction. Error bars indicate SD.

