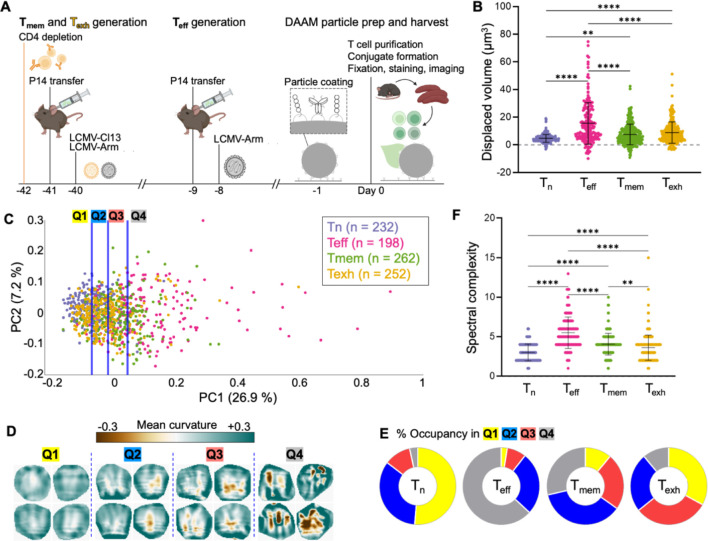
Figure 5. Mechanical activity distinguishes CD8+ T cell differentiation states.
(A) Protocol for in vivo differentiation of CD8+ , and cells expressing the P14 TCR. All three cell types, together with naïve P14 T cells, were isolated concurrently and imaged together with DAAM particles coated with anti-CD3ε and ICAM-1. (B) Deformation volume generated by each T cell subset . (C) Synapse topographies were transformed into Z-pattern spectra and then visualized by PCA. Data points were separated into quartiles (divided by the blue lines) for downstream analysis. (D) Cropped views of representative synapses from each quartile in D. (E) Distribution of each P14 subset across the quartiles of PC space. (F) Spectral complexity metrics for all P14 subsets. In B and F, ** and **** denote and , respectively, calculated by multiple t-testing with Tukey’s correction. Error bars indicate SD.

