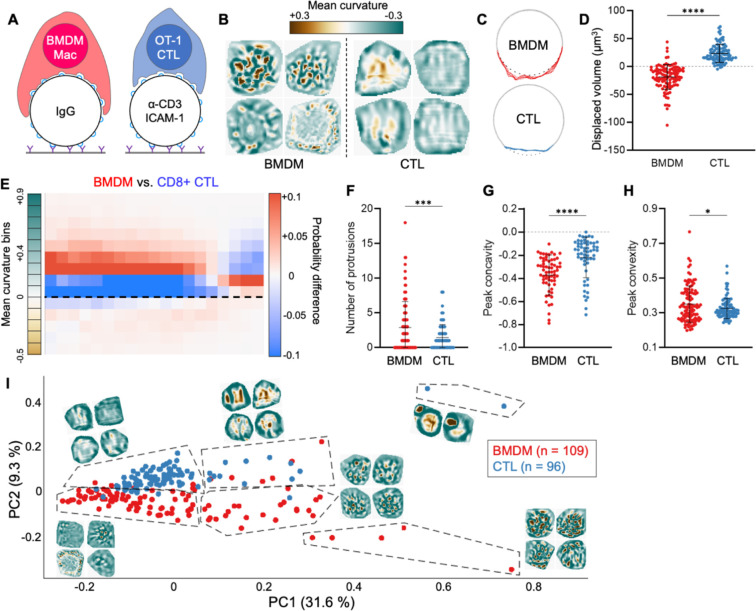
Figure 6. Macrophages and T cells employ inverse interfacial mechanotypes.
(A) OT-1 CTLs and C57BL/6 BMDMs were cultured in parallel and imaged together with anti-CD3ε/ICAM-1 coated and IgG-coated DAAM particles, respectively. (B) Cropped views of representative BMDM and CTL contacts, colored for curvature. (C) Cross-sectional view of representative BMDM and CTL contacts, with contact area colored red and blue, respectively. Gray dotted line indicates the footprint of an unperturbed sphere. (D) Deformation volume of BMDM and CTL contacts . (E) Difference plot of radial curvature distribution, colored red and blue for over-representation of BMDMs and CTLs, respectively. Dotted line indicates 0 curvature (flat). (F-H) Quantification of protrusion number (F), peak indentation concavity (G) and peak relief convexity (H) within BMDM and CTL contacts. (I) BMDM and CTL topographies were transformed into Z-pattern spectra and then visualized by PCA. Representative topographies from each PCA region have been overlaid onto the plot. ns, ***, and **** denote , and , calculated by unpaired Welch’s t-test. All error bars indicate SD.

