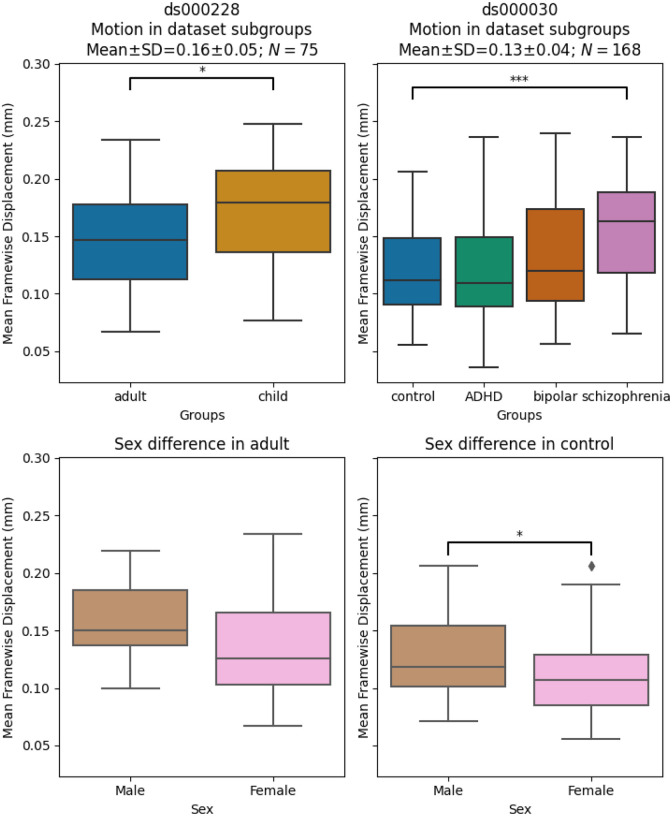
Figure. 3.
Mean framewise displacement of each dataset.
To evaluate the metrics in a practical analytic scenario, we excluded subjects with high motion while preserving 1 minute of data for functional connectivity calculation: gross mean framewise displacement > 0.25 mm, above 80.0% of volumes removed while scrubbing with a 0.2 mm threshold. In ds000228, the child group still had higher motion compared to the adult groups. In ds000030, where all subjects were adults, the control group only showed significant differences in motion with the schizophrenia group. In both datasets, the sample sizes from each group were highly imbalanced (see Table 3), hence no between group differences were assessed in quality metrics analysis.

