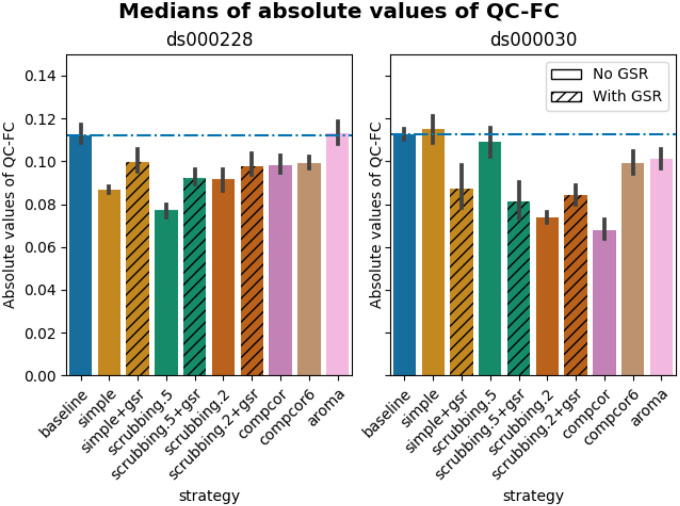
Figure 7.
Medians of absolute values of QC-FC
Median of absolute value of QC-FC, averaged across all atlases of choice. Error bars represent the confidence intervals of the average at 95%. Low absolute median values indicate less residual effect of motion after denoising. The horizontal line represents the baseline. Results observed with absolute QC-FC values are consistent with the percentage of edges with significant QC-FC associations, as reported in Figure 6.

