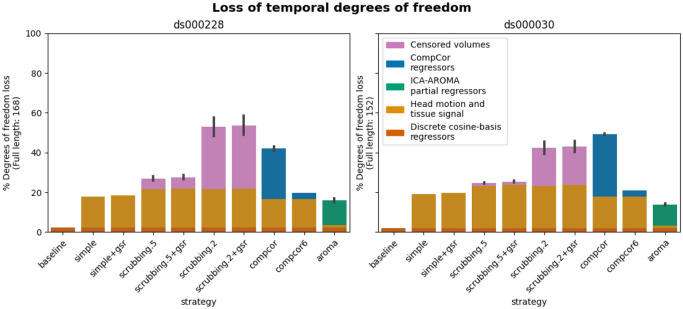
Figure 5. Percentage of loss in temporal degrees of freedom according to strategy and dataset.
Bars show the average percentage of the number of regressors to the length of the scan amongst all subjects. Error bars indicate 95% confidence interval. The two datasets contain different numbers of discrete cosine-basis regressors (ds000228: 4; ds000030: 3). compcor (anatomical CompCor extracted from a WM/CSF combined map, cut off at 50% variance) and ICA-AROMA-based strategies (aroma) show variability depending on the number of noise components detected.

