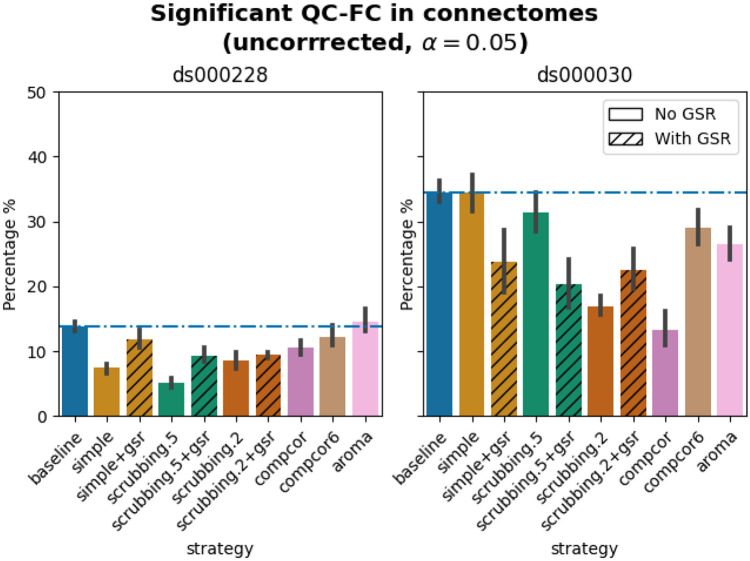
Figure 6. Significant QC-FC in connectomes.
Average percentage of edges significantly correlated with mean framewise displacement are summarized across all atlases as bar plots. Error bars represent the 95% confidence intervals of the average. The horizontal line represents the baseline. A lower percentage indicates less residual effect of motion after denoising on connectome edges. Significant QC-FC associations were detected with p<0.05, uncorrected for multiple comparisons. A version of the figure using false-discovery-rate correction for multiple comparisons can be found in supplemental Jupyter Book.

