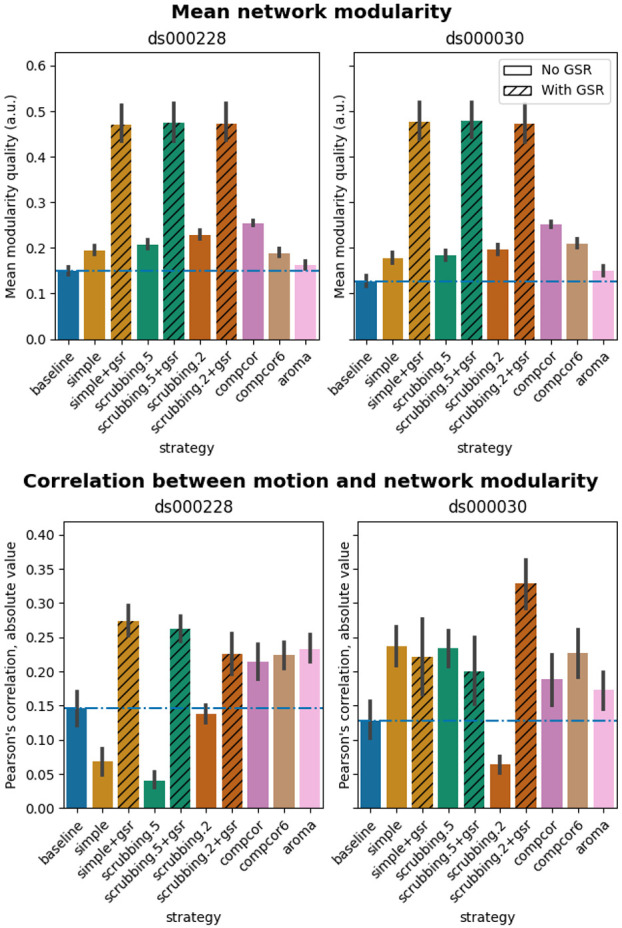
Figure 9. Network modularity measures.

Top: Average Louvain network modularity of all connectomes after denoising. Error bars represent the standard deviation. The horizontal line represents the baseline. In both datasets, strategies including the global signal regressor(s) have higher modularity values. Bottom: Average Pearson’s correlation between mean framewise displacement and Louvain network modularity after denoising. A value closer to zero indicates less residual effect of motion after denoising.
