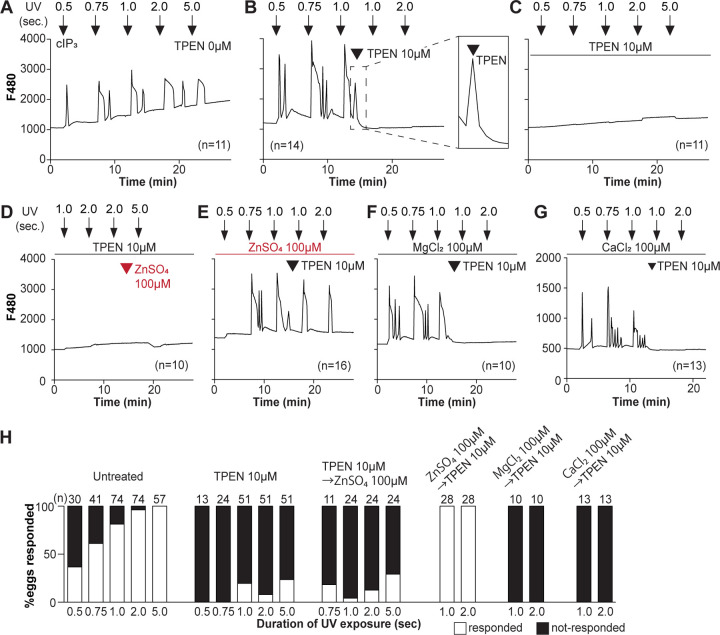
Figure 3. TPEN inhibition of cIP3-induced Ca2+ release is precluded by ZnSO4 supplementation before TPEN exposure.
(A-G) Representative Ca2+ responses in MII eggs triggered by the release of caged IP3 (cIP3) induced by UV light pulses of increasing duration (arrows). (A) A representative control trace without TPEN, and (B) following the addition of 10 μM TPEN between the third and the fourth pulses. The broken line rectangle is magnified in the inset, farthest right side of the panel displaying the near immediate termination of an ongoing rise. (C, D) Recordings started in the presence of 10 μM TPEN but in (D) 100 μM ZnSO4 was added between the second and the third pulses. (E) Recording started in the presence of 100 μM ZnSO4 followed by the addition of 10 μM TPEN between the third and the fourth pulses. (F, G) Recording started in the presence of 100 μM MgSO4 (F) or 100 μM CaCl2 (G) and 10 μM TPEN added as above. Arrowheads above the different panels indicate the time of TPEN or divalent cation addition. (H) Bar graphs summarizing the number and percentages of eggs that responded to a given duration of UV pulses under each of the TPEN±divalent ions.

