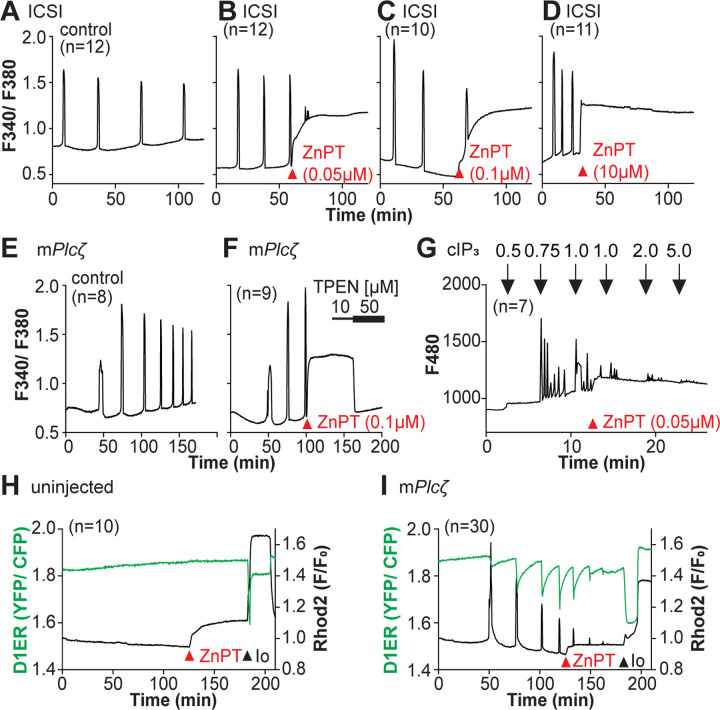
Figure 6. Excess Zn2+ hinders Ca2+ oscillations.
(A-D) ICSI-initiated Ca2+ response without (A) or following the addition of ZnPT (B, C) (the time of ZnPT addition and concentration are denoted above the tracing). (E, F) Representative Ca2+ responses induced by injection of 0.01 μg/μl mPlcζ mRNA in untreated eggs (E) or in eggs treated with 0.1 μM ZnPT followed by 10 μM TPEN first and then 50 μM (F). (G) cIP3-induced Ca2+ release as expected when the UV pulses in the absence but not in the presence of 0.05 μM ZnPT (the time of addition is denoted by a bar above the tracing). (H, I) Representative traces of Ca2+ values in eggs loaded with the Ca2+-sensitive dye Rhod-2 AM and the ER Ca2+reporter, D1ER (1 μg/μl mRNA). Uninjected and 0.01 μg/μl mPlcζ mRNA-injected eggs were monitored. After initiation and establishment of the oscillations, 0.1 μM ZnPT was added into the media followed 30 min later by 2.5 μM Io. Experiments were repeated two different times. Red and black arrowheads indicate the time of addition of ZnPT and Io, respectively.

